讨论用于分析和预测Web服务度量及其应用的各种机器学习技术。
概述
在本文中,我们将讨论各种用于分析和预测web服务度量及其应用的机器学习技术。自动伸缩是这方面的一个很好的应用,其中可以应用预测技术来估计web服务的请求速率。类似地,可以将预测技术应用于服务度量,以预测警报和异常。
在本文中,我将首先讨论时间序列数据及其在预测技术中的作用。稍后,我将演示一个用于预测web服务请求率的预测模型。本文提供了对时间序列预测技术的基本理解,这些技术可以应用于服务度量或任何时间序列数据。

开始…
什么是时间序列?
时间序列是以固定时间间隔收集的数据点的集合。时间序列数据的示例可以从应用程序指标(如以RPM为单位的请求速率)到系统指标(如以固定时间间隔获取的空闲CPU%)不等。
为了利用机器学习技术解决预测问题,需要将数据转换为时间序列格式。时间序列数据具有自然的时间顺序。时间序列分析可以应用于实值、连续数据、离散数值数据或离散符号数据。
为了便于说明,我使用了Python。Numpy、Pandas、Matpoltlib模块将用于转换和分析,Statsmodel将用于预测模型。
import pandas as pd

dateparse = lambda dates: pd.to_datetime(dates, unit = 's')
df = pd.read_csv('ServiceEndpointRpm.csv', parse_dates =

['epoch'], index_col = 'epoch', date_parser = dateparse)
df.describe()
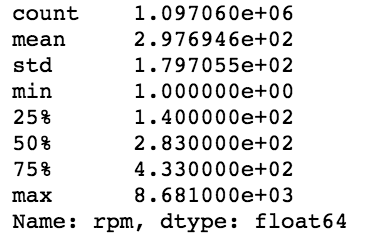
Statistics of Request Rate data
df.tail()

Few data points of time series

import matplotlib.pylab as plt

ts = df["rpm"]

plt.title(label="Service Requests per Minute Graph",
fontsize=32)
plt.plot(ts)
plt.xlabel("Time", fontsize=20)
plt.ylabel("Requests per Minute", fontsize=20)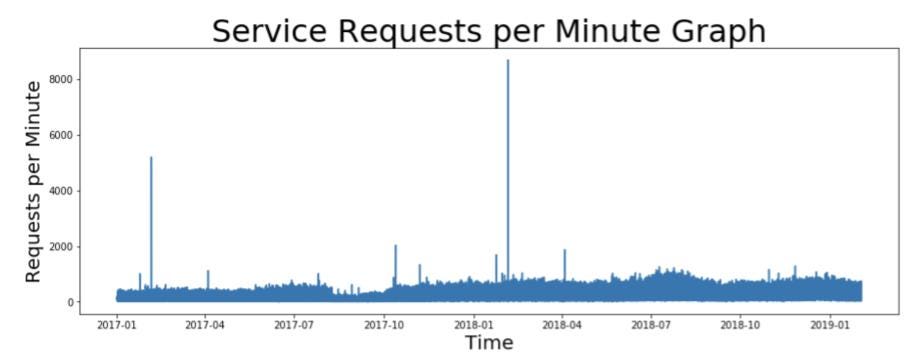
Time series graph representing request rates (in RPM) for a web service taken at every minute of interval.
数据预处理
请看上面RPM中的请求率图表,您是否看到数据存在任何挑战?

在上图中,您可以看到有太多的数据点和尖峰需要处理。

如何处理?

*重采样:每隔一分钟采集所有数据点。将数据重新采样为每小时、
每天或每周有助于减少需要处理的数据点的数量。在本例中,
我们将使用平均每日重采样值。

*变换:可以应用对数、平方根或立方根等变换来处理图形中的峰值。
在本例中,我们将对时间序列执行日志转换。
ts_1d = ts.resample('D', closed='right', label='left').mean()

plt.title(label="Service Requests per Minute Graph", fontsize=32)
plt.plot(ts_1d)
plt.xlabel("Time", fontsize=20)
plt.ylabel("Requests per Minute", fontsize=20)
Observe that large number of data points have reduced and the graph looks smoother as a result of daily resampling.
import numpy as np

ts_1d_log = np.log(ts_1d)

plt.title("Log Transformed RPM Data for Service",
fontsize=32)
plt.xlabel("Time (in Days)", fontsize=20)
plt.ylabel("Logarithm of RPM", fontsize=20)
plt.plot(ts_1d_log)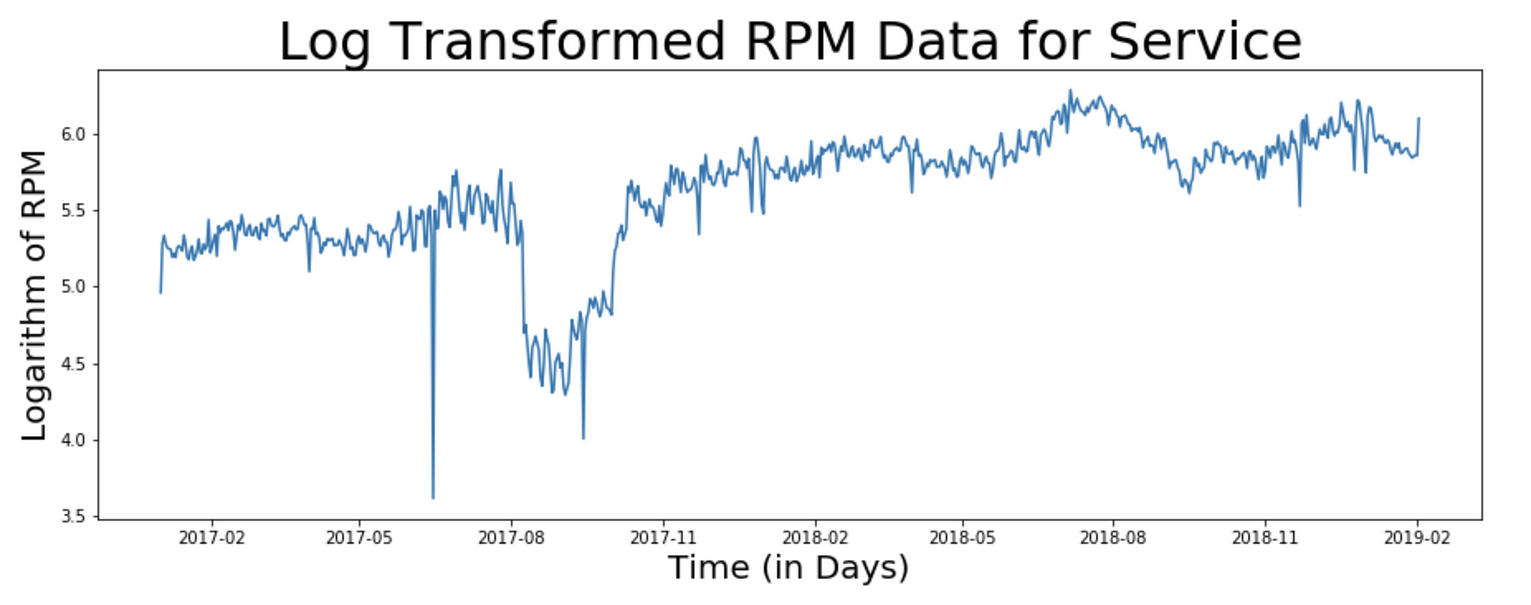
Observe the values on the y-axis as a result of log transformation
时间序列基础
单变量与多变量时间序列
单变量时间序列数据仅由一个变量组成。单变量分析是数据分析的最简单形式,所分析的数据只包含一个变量。因为它是一个单一变量,所以它不处理原因或关系。这种单变量时间序列的一个例子是请求速率度量。
当时间序列由两个变量组成时,它被称为二元时间序列。对这类数据的分析涉及原因和关系,分析的目的是找出这两个变量之间的关系。例如,web服务的CPU使用率为%,这取决于请求速率。这些变量通常绘制在图形的X轴和Y轴上,以便更好地理解数据,其中一个变量是独立的,而另一个是相关的。
多元时间序列由三个或更多变量组成。多变量时间序列的例子可以是依赖于多个变量的股票价格。
时间序列的组成部分
为了找到一个合适的时间序列预测模型,了解时间序列数据的组成部分非常重要。时间序列数据主要由以下部分组成:
趋势
趋势显示数据在长时间内增加或减少的总体趋势。趋势是一种平稳的、普遍的、长期的、平均的趋势。在给定的时间段内,增加或减少的方向并不总是相同的。web服务的请求率可能在很长一段时间内表现出某种移动趋势。
季节性
这些是由于季节性因素而在数据中出现的短期变动。短期通常被认为是一个时间序列发生变化的时期。电子商务网络服务在某些月份可能会收到更多的流量。
周期
这些是发生在时间序列中的长期振荡。
错误
这些是时间序列中的随机或不规则运动。这些是时间序列中发生的不太可能重复的突然变化。
加法与乘法模型
简单分解模型可以是:

加性模型:Y[t]=t[t]+S[t]+e[t]

乘法模型:Y[t]=t[t]*S[t]*e[t]

其中,Y[t]是时间't'的预测值,t[t],S[t]和e[t]分别
是时间't'的趋势分量、季节分量和误差。
from statsmodels.tsa.seasonal import seasonal_decompose
def seasonal_decompose_analysis(timeseries, model, periods):
    decomposition = seasonal_decompose(timeseries,
model = model, freq = periods)

    trend = decomposition.trend
    seasonal = decomposition.seasonal
    residual = decomposition.resid

    plt.subplot(411)
    plt.title('Original', fontsize=20)
    plt.plot(timeseries, label='Original')
    plt.subplot(412)
    plt.title('Trend', fontsize=20)
    plt.plot(trend, label='Trend')
    plt.subplot(413)
    plt.title('Seasonality', fontsize=20)
    plt.plot(seasonal,label='Seasonality')
    plt.subplot(414)
    plt.title('Residuals', fontsize=20)
    plt.plot(residual, label='Residuals')
    plt.tight_layout()

    return decomposition

seasonal_decompose_analysis(ts_1d, 'additive', 365)
Additive Decomposition Model for time series
seasonal_decompose_analysis(ts_1d, 'multiplicative', 365)
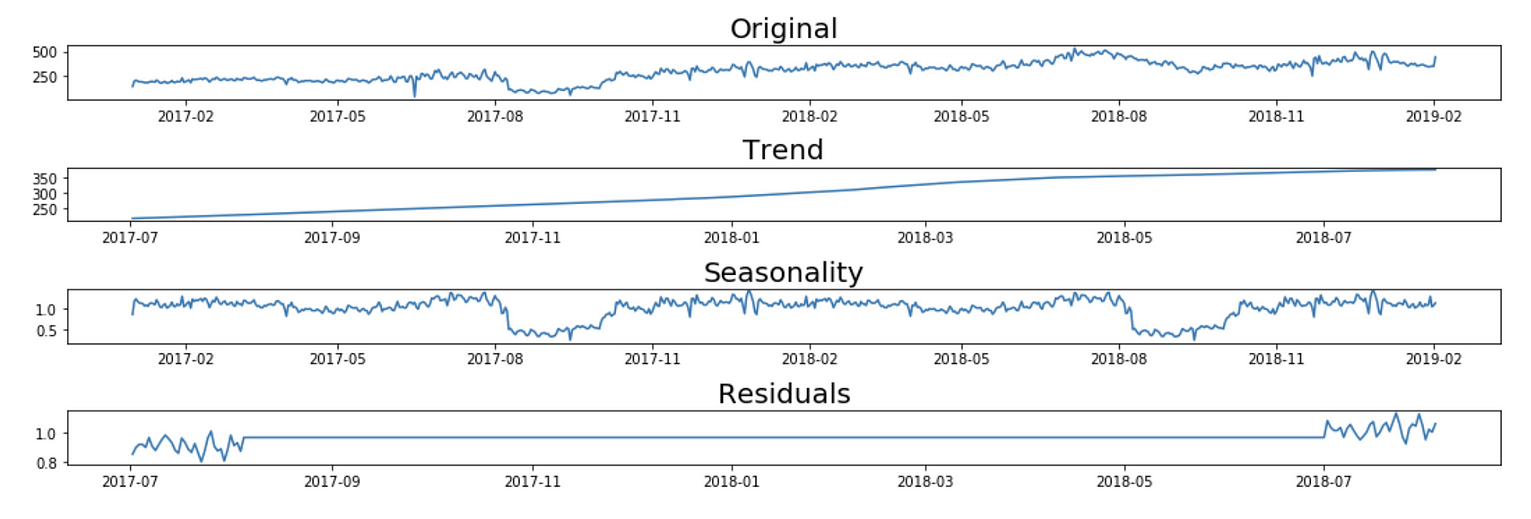
Multiplicative Decomposition Model for time series
平稳序列
如果时间序列在一段时间内具有恒定的统计特性,则称其为平稳的,即:
- 常均值
- 恒定方差
- 不依赖于时间的自协方差。
大多数时间序列模型要求时间序列是平稳的。
如何检查时间序列的平稳性?
以下是检查时间序列平稳性的一些方法:
滚动统计
我们可以绘制移动平均值或移动方差来检查随时间的变化。例如,7天内每分钟请求的滚动平均值。这是一种视觉技术。
富勒检验(Dickey-Fuller Test)
这是检查平稳性的统计测试之一。这是一种单位根测试。测试结果包括一个测试统计量和一些不同置信水平的临界值。如果“检验统计量”小于“临界值”,我们可以拒绝零假设,并说序列是平稳的。这里的零假设是时间序列是非平稳的。
from statsmodels.tsa.stattools import adfuller

def stationarity_test(timeseries, rolling_window):
    rolling_mean = pd.rolling_mean(timeseries,
window=rolling_window)
    rolling_std = pd.rolling_std(timeseries,
window=rolling_window)

    orig = plt.plot(timeseries, color='blue',
label= 'Original')
    mean = plt.plot(rolling_mean, color='red',
label= 'Rolling Mean')
    std = plt.plot(rolling_std, color='black',
label = 'Rolling Std')
    plt.title('Rolling Mean & Standard Deviation')
    plt.show()

    # Dickey-Fuller test
    print('Results of Dickey-Fuller Test')
    test = adfuller(timeseries, autolag='AIC')
    output = pd.Series(test[0:4], index=['Test
Statistic','p-value',
'#Lags Used','Number of Observations Used'])
    for key,value in test[4].items():
        output['Critical Value (%s)'%key] = value
    print(output)

  stationarity_test(timeseries = ts_1d,
rolling_window = 365)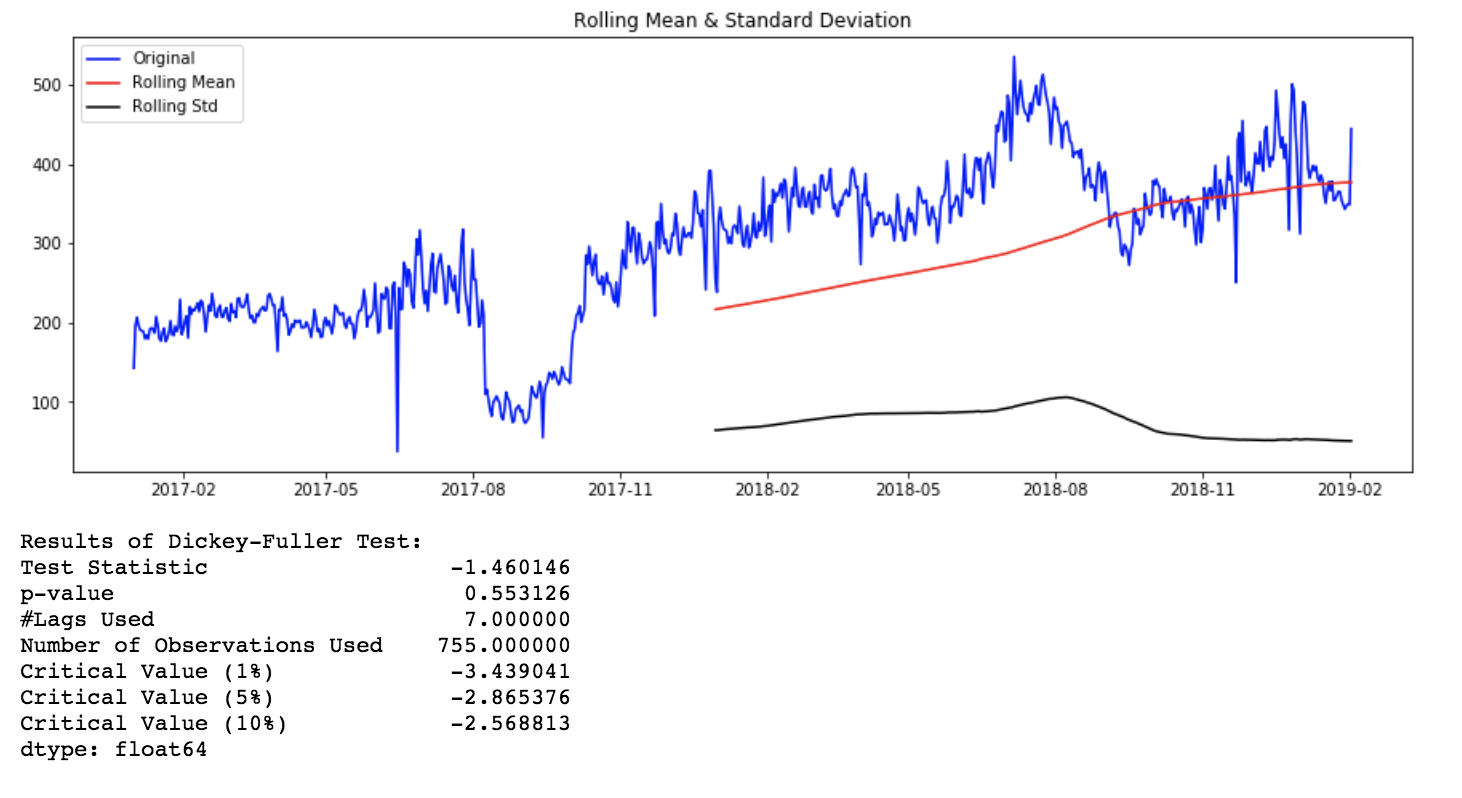
Rolling Stats Plot and AD Fuller Test results for original time series
如何使时间序列保持平稳?
有多种方法可以使时间序列保持平稳。其中有些是差分、去趋势化、变换等。
stationarity_test(timeseries = ts_1d_log_diff_1.dropna(),
rolling_window = 365)
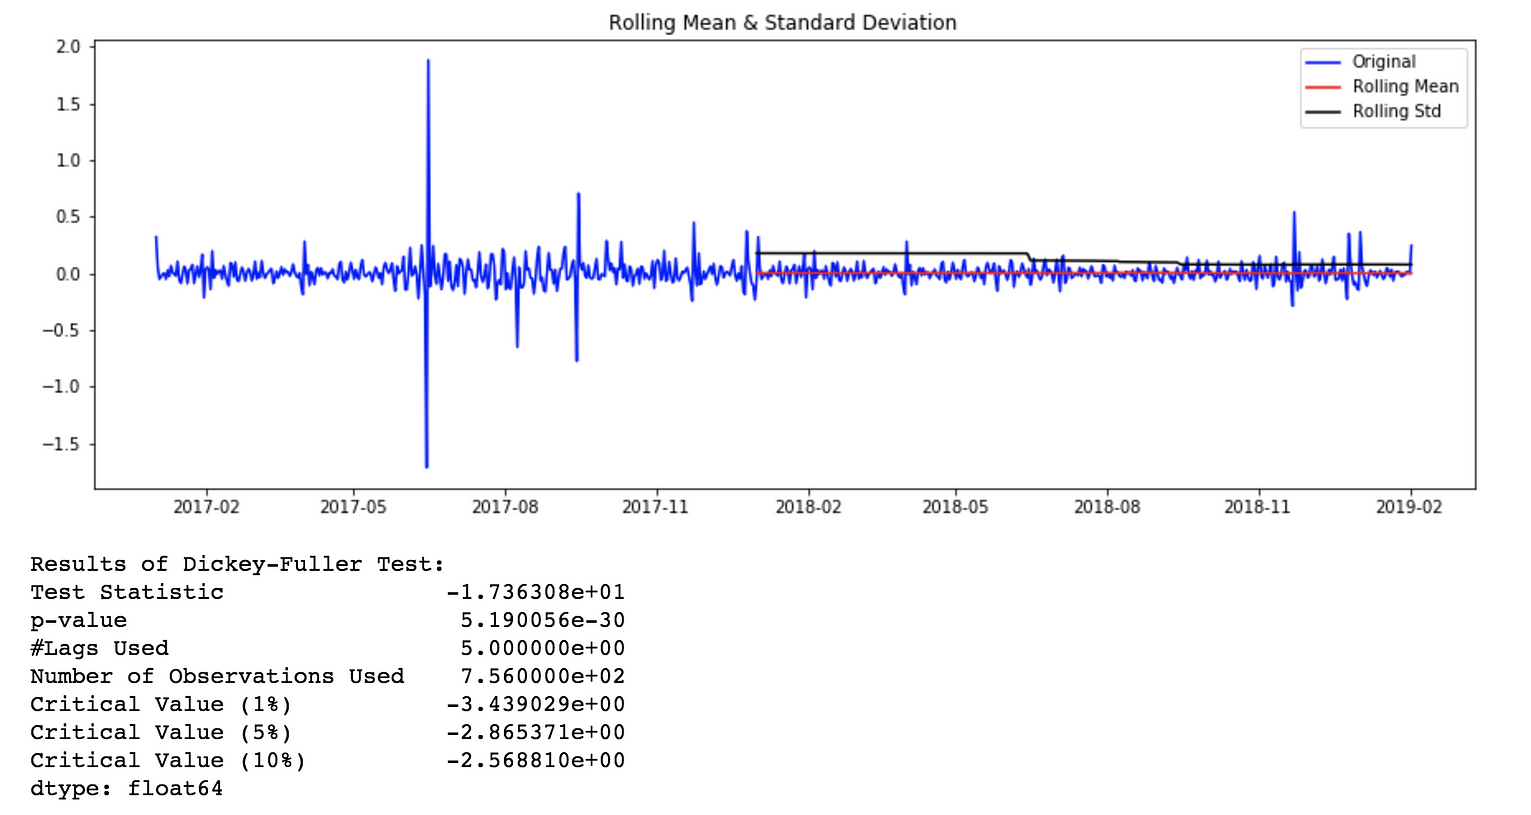
Rolling Stats Plot and AD Fuller Test results for log transformed and differenced time series.
模型拟合与评价
我将广泛讨论两种预测模型,数学模型和人工神经网络。
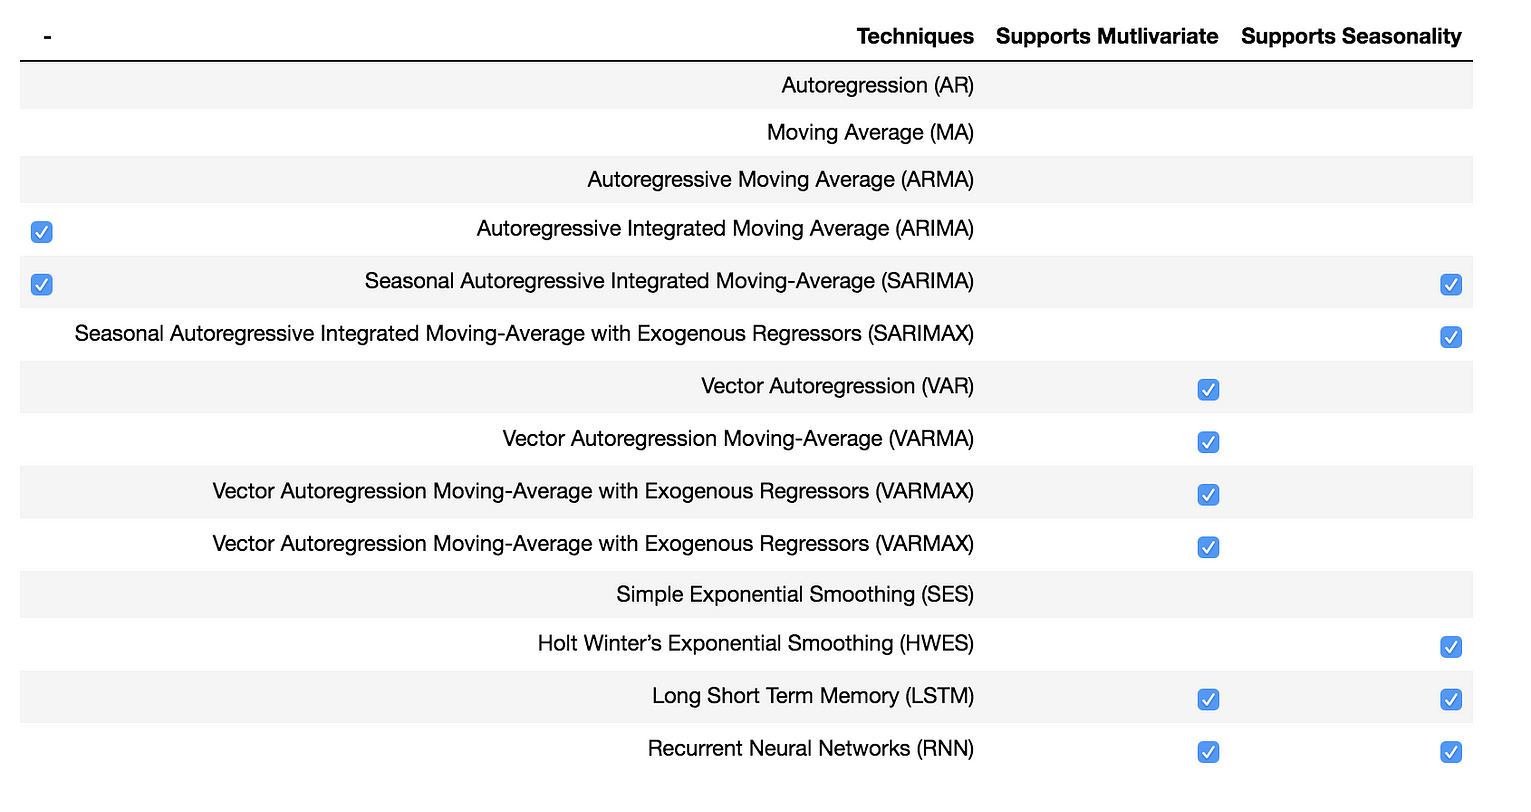
Predictive Models
数学模型
下面将介绍一些经典的时间序列预测模型。我将为我们的场景演示SARIMA模型。
AR、MA、ARMA、ARIMA等模型都是SARIMA模型的简单例子。VAR、VARMA、VARMAX与前面提到的模型类似,它们适用于向量数据而不是单变量时间序列。
在某些情况下,霍尔特-温特模型可用于预测存在季节性成分的时间序列。
萨里玛模型(SARIMA Model)
当时间序列中存在趋势和季节性时,非常流行的方法是使用季节性自回归综合移动平均(SARIMA)模型,该模型是ARMA模型的推广。
SARIMA模型由SARIMA(p,d,q)(p,d,q)[S]表示,其中
- p、 q指ARMA模型的自回归和移动平均项
- d是差异程度(减去数据过去值的次数)
- P、 D和Q是指ARIMA模型季节部分的自回归、差分和移动平均项。
- S指每个季节的时段数
模型参数估计
*对于SARIMA(p,d,q)(p,d,q)[S]模型,我们需要估计7个参数。

*从季节分解可以看出,时间序列数据具有季节性。因此,S=365,
表示季节变化滞后365天。

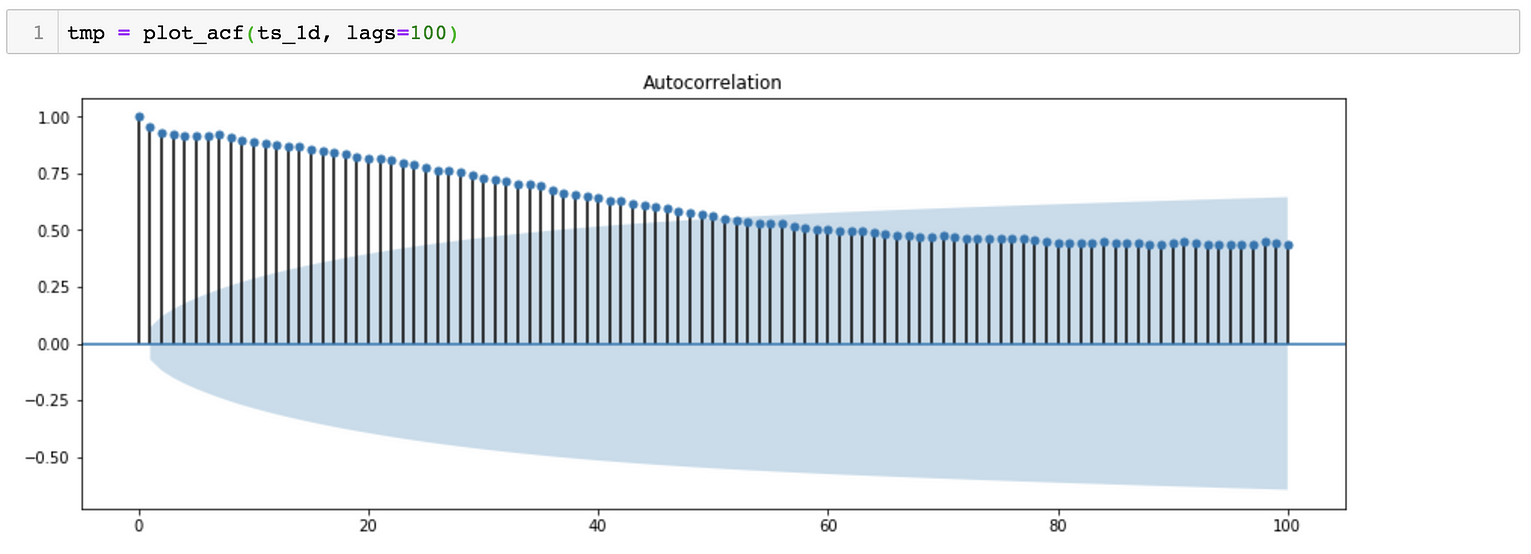
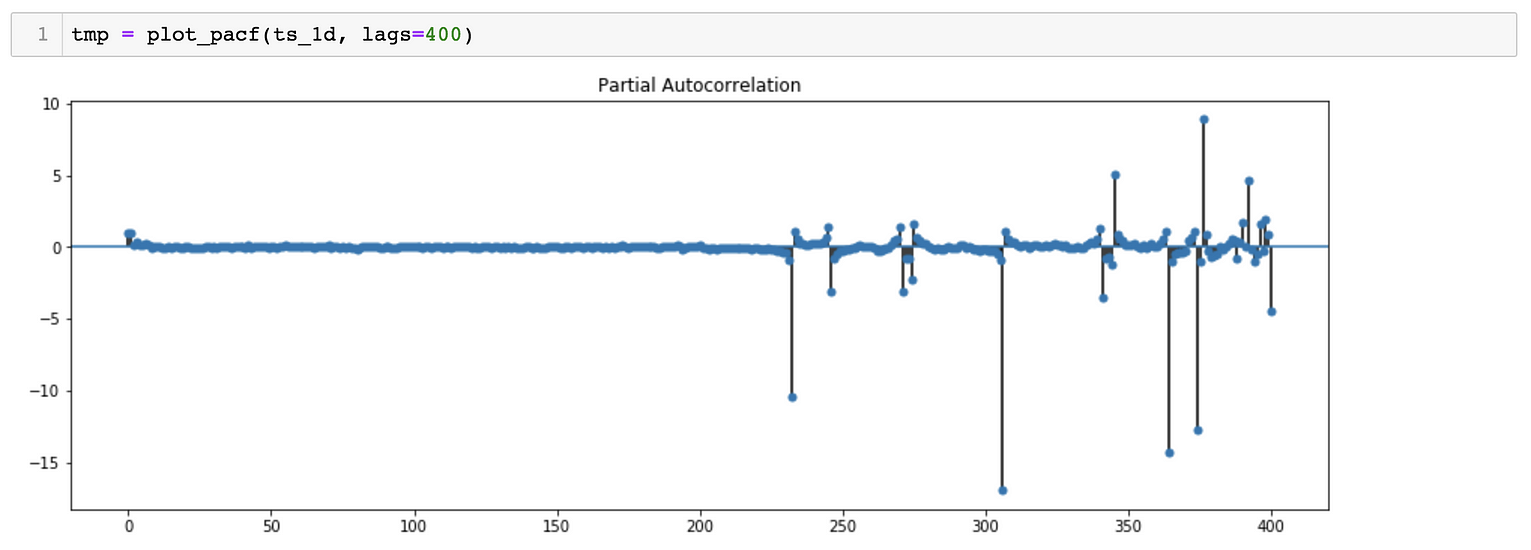
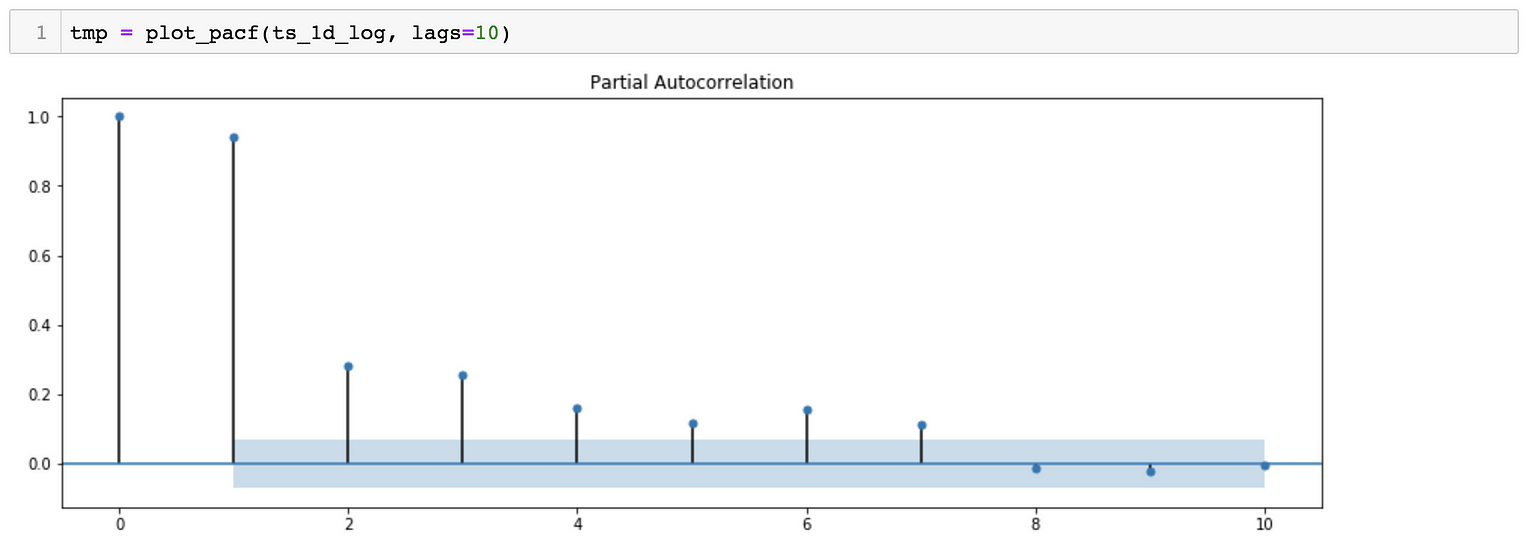
*对于p、q、p&q参数,我们可以绘制ACF(自相关函数)和PACF(偏自相关函数),
对于参数d&d,我们可以尝试绘制相同的曲线图,但时间序列不同。
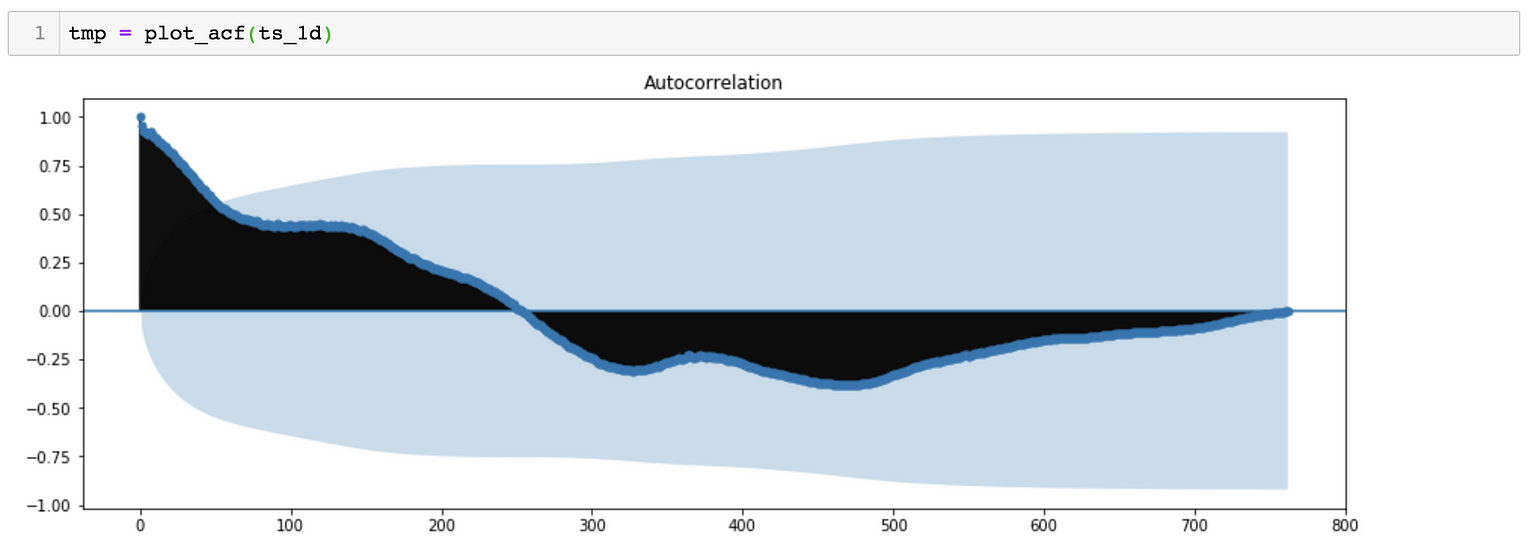
ACF Plot suggests a possibility of P = 0 and D = 0
ACF Plot suggests a possibility of p ~ 43 and d = 0
PACF Plot suggests a possibility of Q = 0 and D = 0
PACF Plot suggests a possibility of q ~ 7 and d = 0
*估计参数的另一种方法是尝试多组值,以找到AIC(Akaike信息标准)值相对较小的模型。
*该模型的估计参数为:SARIMA(2,1,4)(0,1,0)[365]
训练和测试数据集分割
与其他机器学习模型一样,为了评估模型的准确性,我们将数据集分为训练数据集和测试数据集。这一比率可能在60%到90%之间变化。在我们的例子中,由于数据点的数量较少,我将保持95%的比率。保持比率为95%的另一个原因是,为了使SARIMA模型能够准确预测,训练数据集应该有足够的两个季节的数据点。
t_ratio = 0.95
t_size = int(len(ts_1d_log) * t_ratio)

train_1d_log, test_1d_log = ts_1d_log[:t_size].asfreq('D'),
ts_1d_log[t_size:].asfreq('D')

print("Original Data Length =", len(ts_1d_log))
print("Training Data Length =", len(train_1d_log))
print("Test Data Length     =", len(test_1d_log))

# Original Data Length = 763
# Training Data Length = 724
# Test Data Length     = 39
Model will be trained with 2 years data and tested with 39 days data.
模型拟合
拟合的数据是每日平均重采样和对数转换的时间序列。为模型调用估计参数(2,1,4)(0,1,0)[365]。观察此型号的AIC值为-296.90。
import statsmodels.api as sm

sarima_model = sm.tsa.statespace.SARIMAX(train_1d_log,
                            order=(2, 1, 4),
                            seasonal_order=(0, 1, 0, 365),
                            enforce_invertibility=False,
                            enforce_stationarity=False)

result_sarima = sarima_model.fit()

print('SARIMA - AIC : {}'.format(result_sarima.aic))

# SARIMA - AIC : -296.90534927970805
预测
既然模型经过训练,我们就可以进行预测了。为此,我们可以提供要预测的步数作为参数。
pred_sarima = result_sarima.predict(start=0, end=800)

plt.title('Model Fitting and Forecasting', fontsize=32)
plt.xlabel('Future Time (in Days)', fontsize=20)
plt.ylabel('Predicted Avg. Daily RPM', fontsize=20)

plt.plot(train_1d_log, label='Training')
plt.legend(loc='best')

plt.plot(test_1d_log, label='Test')
plt.legend(loc='best')

plt.plot(pred_sarima['2018-12-26':'2019-02-02'], label='Predicted')
plt.legend(loc='best')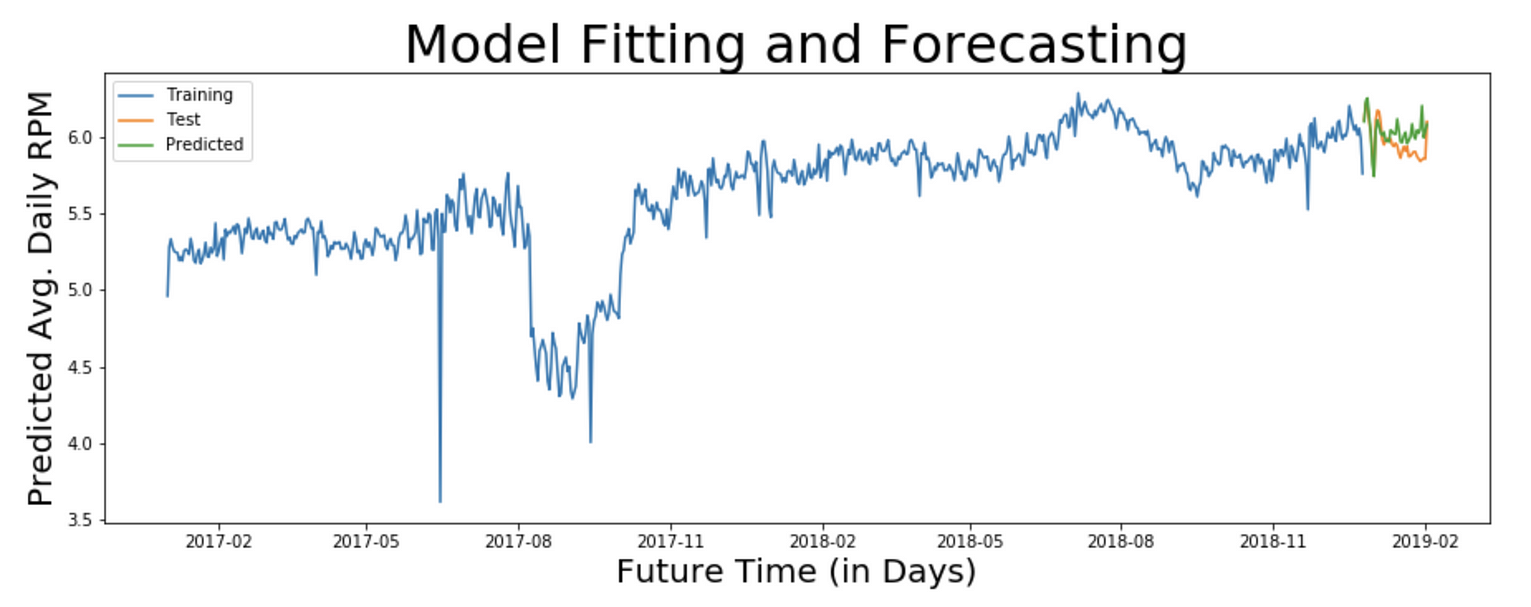
Graph showing Training, Test and Predicted values for Average Daily and Log Transformed RPM values for the service.
注:观察本文开头原始图表和上述预测图表中y轴上的值。web服务的RPM值约为300,预测值约为5,这是因为预测值经过转换。我们需要应用逆变换来获得原始尺度上的值。根据我们应用的变换,你能猜出哪个逆变换是合适的吗?
基于应用的对数变换,我们需要应用指数变换进行反演。在评估预测之前需要这样做,因为我们需要知道原始尺度上预测值的准确性。
验证预测
现在,我们已经将预测值反变换回原始比例,我们可以评估预测模型的准确性。
为此,我们需要找到原始测试值和预测测试值之间的误差,以计算:
- *均方误差(MSE)
- *均方根误差(RMSE)
- *变异系数
- *四分位分散系数等
由于我们的数据集只有39个数据点,我们将能够评估39天的预测。让我们对模型进行39天和20天的评估,以比较结果。
39天预测
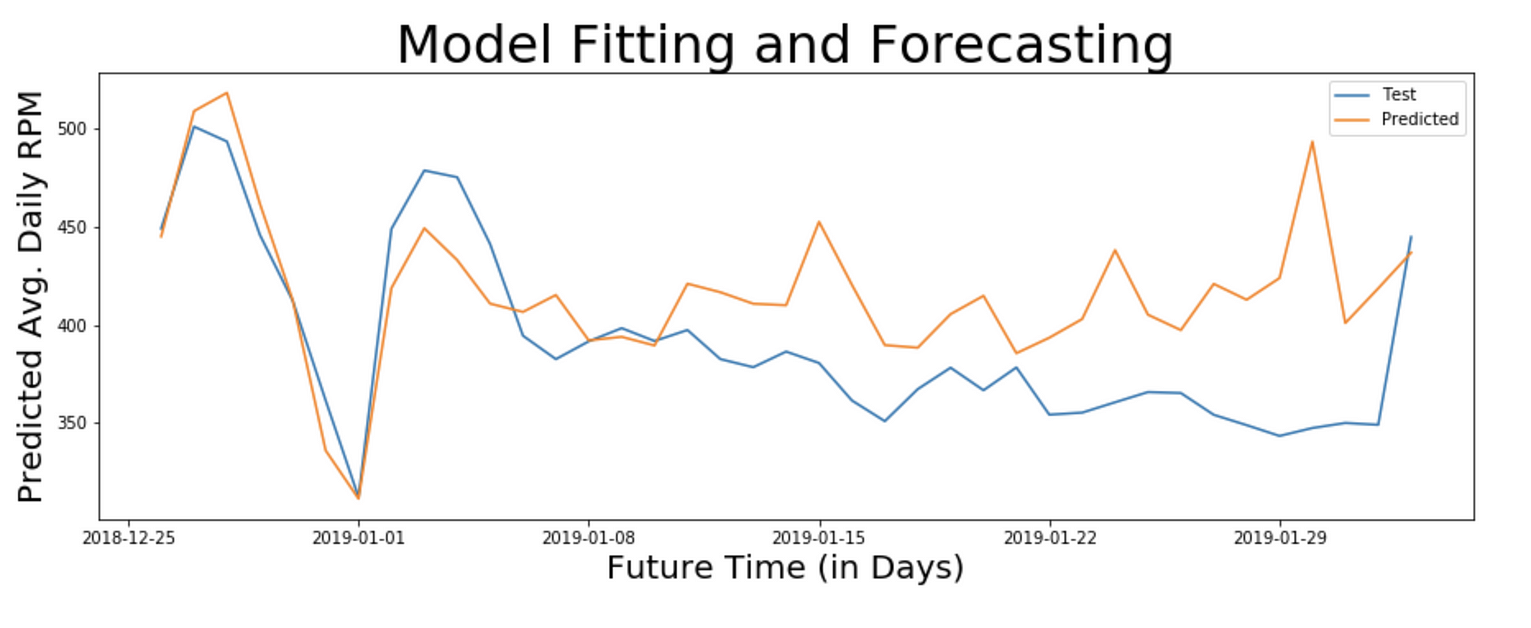
Actual and Predicted RPM for 39 days
mse_38d = mean_squared_error(np.exp(test_1d_log),
np.exp(pred_sarima_214_010_365_1d_log['2018-12-26':'2019-02-02']))
rmse_38d = np.sqrt(mse_38d)
cov_38d = rmse_38d / (np.exp(test_1d_log)).mean() * 100

print ("Mean Squared Error (MSE) =", mse_38d)
print ("Root Mean Squared Error (RMSE) =", rmse_38d)
print ("Coefficient of Variation =", cov_38d, "%")

# Mean Squared Error (MSE) = 2071.720645305662
# Root Mean Squared Error (RMSE) = 45.51615806837899
# Coefficient of Variation = 11.645373540724746 %
注:变异系数为11.645,这意味着该模型能够预测未来39天服务的日平均RPM,准确率为88%。
20天预测
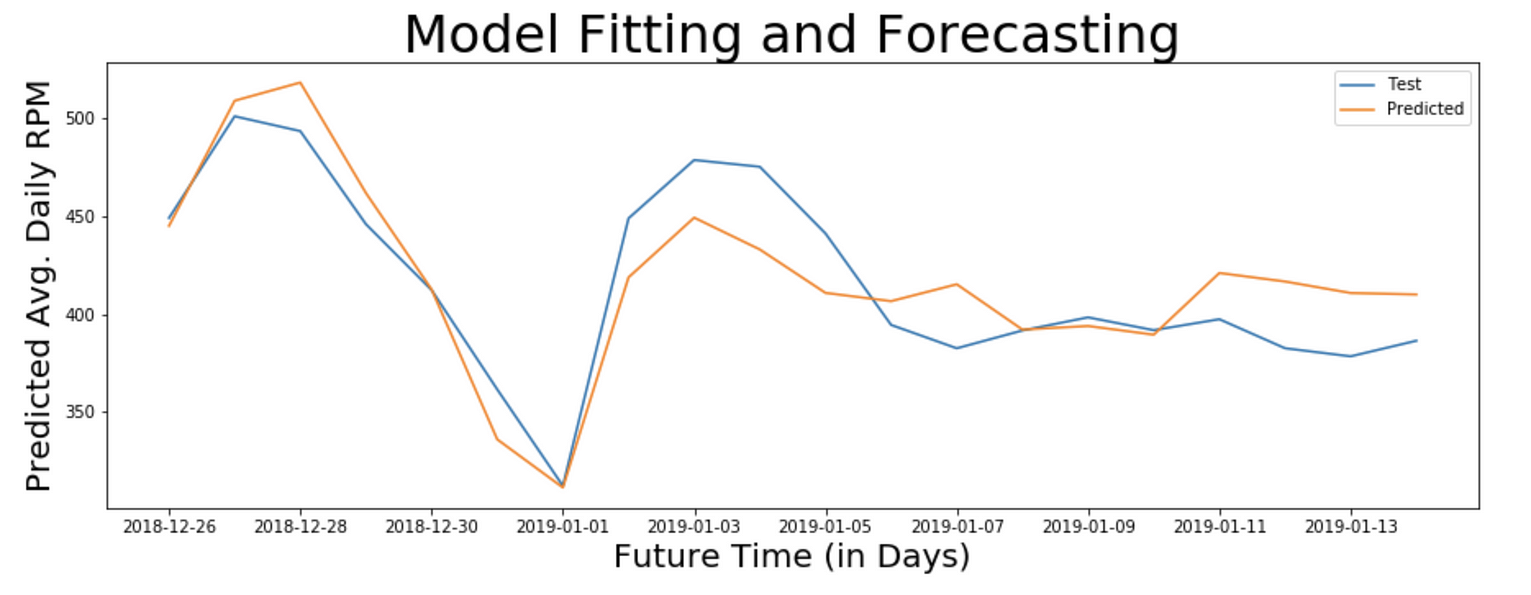
Actual and Predicted RPM for 20 days
mse_20d = mean_squared_error(np.exp(test_1d_log[0:20]),
np.exp(pred_sarima_214_010_365_1d_log['2018-12-26':'2019-01-14']))
rmse_20d = np.sqrt(mse_20d)
cov_20d = rmse_20d / (np.exp(test_1d_log[0:20])).mean() * 100

print ("Mean Squared Error (MSE) =", mse_20d)
print ("Root Mean Squared Error (RMSE) =", rmse_20d)
print ("Coefficient of Variation =", cov_20d, "%")

# Mean Squared Error (MSE) = 533.8336605253844
# Root Mean Squared Error (RMSE) = 23.10484062973351
# Coefficient of Variation = 5.552258462827946 %
注:变异系数为5.55,这意味着该模型能够预测未来20天服务的日平均RPM,精确度为94%。
神经网络
基于预测的问题的神经网络模型与数学模型的工作方式不同。递归神经网络(RNN)是一类具有时间动态特性的人工神经网络。
LSTM(长-短期记忆)是最合适的RNN之一。为了发展LSTM模型,必须将时间序列预测问题重新定义为监督学习问题。
结论
- 为了预测某些指标,如web服务的响应时间,需要非常有效的模型来预测实时时间序列数据。
- 每个度量都有与其相关联的时间步长的适当粒度。对于预测响应时间,合适的时间步长粒度为秒或分钟。而对于自动缩放,预测每日RPM就足够了。
- 在预测涉及多变量时间序列(如CPU使用率%或磁盘交换)的复杂指标时,应选择适当的模型,因为它可能不是单变量时间序列,且多个变量必须影响其值。
- 为预测一个指标而开发的预测模型可能不适用于另一个指标。
- 通过使用更大的数据集对模型进行训练并微调模型参数,可以提高模型的精度。
进一步阅读
- 要了解本文中提到的其他时间序列预测模型的更多信息,您可以阅读Winter Holt和LSTM。
- 要了解多变量时间序列的时间序列分析,请阅读Granger因果关系检验。
- 对于ACF和PACF图,请参考自相关和偏自相关。
- To know more about other time series prediction models mentioned in this article you can read Winter-Holt and LSTM.
- To understand time series analysis of multi-variate time series, read up on Granger Causality test.
- For ACF and PACF Plots refer to Autocorrelation and Partial Autocorrelation.
原文:https://towardsdatascience.com/time-series-analysis-and-forecasting-of-…
Tags
最新内容
- 2 weeks ago
- 2 weeks ago
- 2 weeks ago
- 2 weeks ago
- 2 weeks ago
- 2 weeks ago
- 2 weeks ago
- 2 weeks ago
- 2 weeks ago
- 2 weeks ago