是时候升级你的可视化游戏了!
数据可视化是人脑有效理解任何信息的最舒适、最直观的方式。 对于任何使用数据的人来说,创建漂亮直观的可视化的能力是一项非常重要的技能,必须能够有效地传达调查结果并推动行动。
R,提供了一些很棒的数据可视化(ggplot2,传单)和仪表板(使用 R Shiny)包,您可以使用它们创建漂亮的可视化。 另一方面,Python 在这方面有点落后,因为 matplotlib 不是一个很好的可视化包。
Seaborn 是在 python 中创建静态图的不错选择,但不具备使这些交互的能力。 对于静态绘图,我们无法放大绘图的有趣部分,将鼠标悬停在绘图上以查看特定信息等等。
所以,Plotly 包来了!

Plotly 是一个 Python 库,用于创建交互式、出版质量的可视化。 Plotly 不仅使绘图具有交互性,这是 matplotlib 或 seaborn 中缺少的功能,而且还提供了各种更多的图表,例如:
- 统计图表,例如树状图、误差带、平行类别图等。
- 科学图表,例如等高线图、对数图等。
- 财务图表,如漏斗图、烛台图等
- 气泡图、密度图等地图。
- 生物信息学等等。
这就是为什么你应该在 matplotlib 或 seaborn 上使用 plotly 的理论解释。
现在,让我们实际看看!
在下一节中,我们将使用 gapminder 数据来可视化印度和中国多年来在社会和经济方面的进步。我们将对 pandas 数据框进行数据选择和操作,如果您是 pandas 的新手,那么您可以学习 Python 进行数据分析。
您可以打开 jupyter notebook 直接使用代码,无需任何修改。让我们首先安装 plotly 包并导入所需的包。
# install plotly
! pip install plotly

# import plotly packages
import plotly.graph_objects as go
import plotly.express as px
使用 graph_objects 模块,我们将创建不同类型的图,并且 express 模块将用于读取 gapminder 数据。 现在,让我们使用 plotly express 读取 gapminder 数据并查看前 5 行。
## reading the data and looking at the 1st five rows using head()
df = px.data.gapminder()
df.head()

从上表可以看出,数据包含了不同国家不同年份的预期寿命、人口、人均GDP等信息。 现在,我们将过滤印度和中国的数据框。
# reading the datasets for India and China
df_india = df[df['country'] == 'India']
df_china = df[df['country'] == 'China']
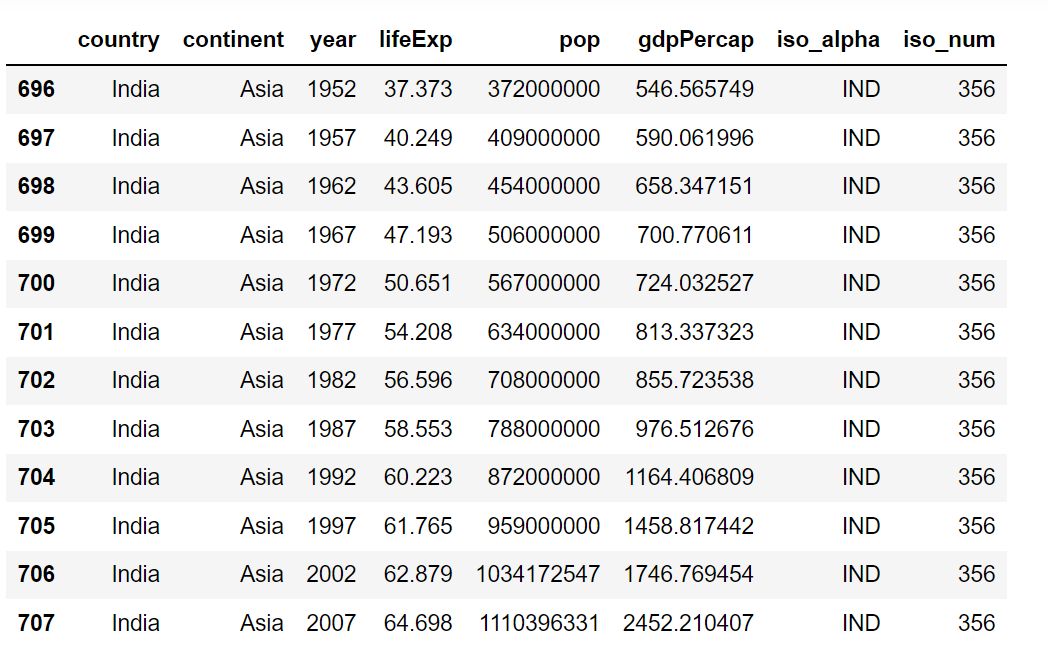
df_india
下表显示了印度的数据。 数据范围从 1952 年到 2007 年。

印度和中国的人口
现在,我们将创建一个条形图,显示多年来印度和中国的人口。 使用 plotly graph object 模块创建绘图是一个 2 步过程:
- 设置图形函数,我们将在其中设置数据参数。 data 参数设置为具有印度和中国的条形功能(go.Bar)的列表。 在 bar 函数中,我们将 x 轴设置为年份列,y 轴设置为人口列,标记颜色设置为印度红/蓝色,条形名称设置为国家名称。
- 使用 update_layout 函数设置图表的标题、x 轴和 y 轴的文本。
## Using figure function to define the data argument and setting it
##to the bars for India and China
fig = go.Figure(data = [go.Bar(x = df_india['year'],
                y = df_india['pop'], marker_color = 'indianred',name = 'India'),
                 go.Bar(x = df_china['year'], y = df_china['pop'],
                marker_color = 'blue',name = 'China')
                ])

## Setting the titles, xaxis and yaxis
fig.update_layout(title='Population of India and China over the years',
                   xaxis_title='Years',
                   yaxis_title='Population',
                   )

fig
从上面的图表中,我们可以看到两国的人口以相似的速度增长。
多年来的预期寿命
每当我们有时间序列数据(年/月/周等的测量值)时,折线图是显示趋势的最佳选择。 使用以下代码,我们展示了多年来印度和中国的预期寿命如何变化。
# step 1 : Setting the figure function
fig = go.Figure(data = [go.Scatter(x = df_india['year'], y = df_india['lifeExp'],\
                                    line = dict(color = 'firebrick', width = 4),
                                    text = df_india['country'], name = 'India'),
                        go.Scatter(x = df_china['year'], y = df_china['lifeExp'],\
                                   line = dict(color = 'blue', width = 4),
                                  text = df_china['country'], name = 'China')])


# step 2 : Setting the update_layout function
fig.update_layout(title='Life Expectency over the years',
                   xaxis_title='Years',
                   yaxis_title='Life Expectancy (years)',
                   )
fig
两国的预期寿命一直存在差距,除了 1960 年左右,中国的预期寿命因“中国大饥荒”而突然下降。
多年来的预期寿命与人均GDP
当我们想查看 2 个连续(数字)特征之间的交互时,散点图是首选图。
在下面的代码中,我们正在创建两个国家的预期寿命和人均 GDP 之间的散点图。
fig = go.Figure(data = [go.Scatter(y = df_india['lifeExp'], x = df_india['gdpPercap'],\
                                   mode = 'markers', name = 'India')
                        ,
                       go.Scatter(y = df_china['lifeExp'], x = df_china['gdpPercap'],\
                                   mode = 'markers', name = 'China')
                       ])


fig.update_layout(title='Life Expectency vs GDP per Capita',
                   yaxis_title='Life Expectancy (years)',
                   xaxis_title='gdpPercap',
                   )
fig
这两个国家的预期寿命都随着人均国内生产总值的增加而增加。 与印度相比,中国的人均GDP有了显着提高。
随着时间的推移世界发展:动画
使用气泡图,我们可以在 2D 图上显示 3 个维度(x 轴、y 轴和气泡大小)。 使用以下代码,我们可以使用 plotly express 模块的 scatter 函数创建气泡图。
df = px.data.gapminder()

fig = px.scatter(df, x = 'gdpPercap', y = 'lifeExp', size = 'pop',
                 color = 'continent', hover_name='country',
                 log_x= True, size_max=50, title = 'World Development in 2007',
                 animation_frame="year", animation_group="country", range_y = [25,90])

fig.update_layout(xaxis = dict(showgrid=False), yaxis = dict(showgrid=False))

fig
让我们了解该函数的一些重要参数:
- 大小:这设置为将捕获气泡大小的数字列。
- 颜色:这是在一个分类列中设置的,它将捕获气泡的颜色。 在我们的示例中,默认情况下为每个大陆分配一种颜色。
- log_x :将 X 轴(人均 GDP)设置为对数刻度。
- size_max:设置气泡的最大尺寸,当设置尺寸参数时。 这充当尺寸标准化参数。
- animation_frame:用于为动画帧分配标记的数据帧列的值。 在我们的示例中,参数设置为年份列。
- animation_group:与“animation_group”匹配的行将被视为每帧描述相同的对象。 我们想看看每个国家多年来的进展情况,因此将其设置为国家列。

这些年来,世界各国都取得了长足的进步。 我们可以看到所有国家的预期寿命与人均 GDP(均随时间增加)之间的直接相关性。 可以从此图表中得出更多发现,在评论中分享您的发现。
更重要的是!
您还可以使用 plotly 创建交互式仪表板。 Dash 是一个无需学习 HTML、CSS 和 Javascript 即可快速创建漂亮的 Python 仪表板的绘图框架。
原文:https://medium.com/codex/dont-use-matplotlib-or-seaborn-for-your-python…
Tags
最新内容
- 2 weeks 3 days ago
- 2 weeks 3 days ago
- 2 weeks 3 days ago
- 2 weeks 3 days ago
- 2 weeks 3 days ago
- 2 weeks 3 days ago
- 2 weeks 3 days ago
- 2 weeks 3 days ago
- 2 weeks 3 days ago
- 2 weeks 3 days ago