
category
本文是与来自Arize AI的Rich Young共同撰写的。
基于自主工作流的自主人工智能(AI)应用与传统工作负载在一个重要方面有所不同:它们具有非确定性。也就是说,对于相同的输入,它们可能产生不同的结果。这是因为它们所基于的大型语言模型(LLM)在生成每个标记时都会使用概率。这种固有的不可预测性可能会促使AI应用设计者提出与行动修正计划、智能体的最优路径以及具有正确参数的正确工具集相关的问题。想要部署此类自主工作负载的组织需要一个可观察性系统,以确保它们产生的结果是正确的且可信赖的。
在本篇文章中,我们将介绍Arize AX服务如何追踪和评估通过Strands Agents启动的AI智能体任务,从而帮助验证智能体工作流的正确性和可信度。
生成式人工智能应用的挑战
从有前景的人工智能演示到可靠的生产系统,这一过程中充满了许多组织所低估的挑战。根据行业研究和实际部署情况,团队面临着几个关键障碍:
- 大规模环境下的不可预测行为——在测试中表现良好的智能体在生产环境中遇到意外输入时可能会失败,例如新的语言变体或特定领域的行话,这些都会导致无关或被误解的响应。
- 隐藏的故障模式——智能体可能产生看似合理但错误的输出,或跳过某些步骤而不被察觉,例如以一种看似正确但误导决策的方式错误计算财务指标。
- 非确定性路径——智能体可能会选择低效或不正确的决策路径,例如对一个本应只需5步就能完成的查询执行10步操作,从而导致用户体验不佳。
- 工具集成复杂性——智能体在错误调用API时可能会崩溃,例如,传递错误的订单ID格式,导致退款操作虽库存更新成功,但退款却悄无声息地失败了。
- 成本与性能的波动性——循环或冗长的输出可能导致代币成本失控和延迟激增,例如,一个智能体进行了20多次大型语言模型(LLM)调用,导致响应延迟从3秒增加到45秒。
这些挑战意味着,传统的测试和监控方法对于人工智能系统来说是不够的。要想取得成功,需要采用一种更具思考性的方法,并结合更全面的策略。
Arize AX提供了一个全面的可观察性、评估和实验框架
Arize AX是一款企业级人工智能(AI)工程服务,可帮助团队从开发到生产生命周期对AI应用程序进行监控、评估和调试。AX融合了Arize的Phoenix基础,增添了企业级必备功能,如“Alyx”AI助手、在线评估、自动提示优化、基于角色的访问控制(RBAC),以及企业级规模和支持。AX为组织提供了一套全面的解决方案,既满足技术人员的需要,也满足非技术人员的需要,使他们能够从开发到生产阶段大规模管理和改进AI智能体。Arize AX的功能包括:
- 追踪——利用OpenTelemetry全面监控大型语言模型(LLM)的运行情况,捕捉模型调用、检索步骤以及诸如标记和延迟等元数据,以便进行详细分析。
- 评估——通过大型语言模型(LLM)作为评判者对生产样本进行自动化质量监控评估,支持自定义评估器和明确的成功指标。
- 数据集——维护版本化、具有代表性的数据集,用于边缘情况测试、回归测试和A/B测试,并使用真实生产示例进行更新。
- 实验——进行受控测试,以衡量提示或模型变更的影响,并通过统计严谨性验证改进效果。
- 游乐场——一个交互式环境,用于重放轨迹、测试提示变化,并比较模型响应,以实现有效的调试和优化。
- 提示管理——像管理代码一样管理提示,包括版本控制、测试和部署,同时进行性能跟踪和逐步推出,以便尽早发现回归问题。
- 监控与警报——针对延迟、错误、令牌使用和漂移提供实时仪表板和警报,并对关键问题进行升级处理。
- 智能体可视化——分析并优化智能体决策路径,以减少循环和低效情况,完善规划策略。
这些组件构成了一个全面的可观察性策略,该策略将大型语言模型(LLM)应用程序视为需要持续监控、评估和改进的关键任务生产系统。
Arize AX与Strands Agents:强强联手
- Strands Agents是一个开源软件开发工具包(SDK),它是一个功能强大的低代码框架,用于以最小的开销构建和运行人工智能智能体。Strands旨在简化复杂智能体工作流程的开发,它统一了提示,
- 该工具集成了工具、大型语言模型(LLM)交互和集成协议,提供了一种简洁高效的体验。它既支持亚马逊Bedrock托管的模型,也支持外部模型,并内置了检索增强生成(RAG)功能,
- 模型上下文协议(MCP)和Agent2Agent(A2A)
- 通信。在本节中,我们将逐步介绍如何使用Strands Agent SDK构建智能体,使用Arize AX对其进行插装以进行基于跟踪的评估,并优化其行为。
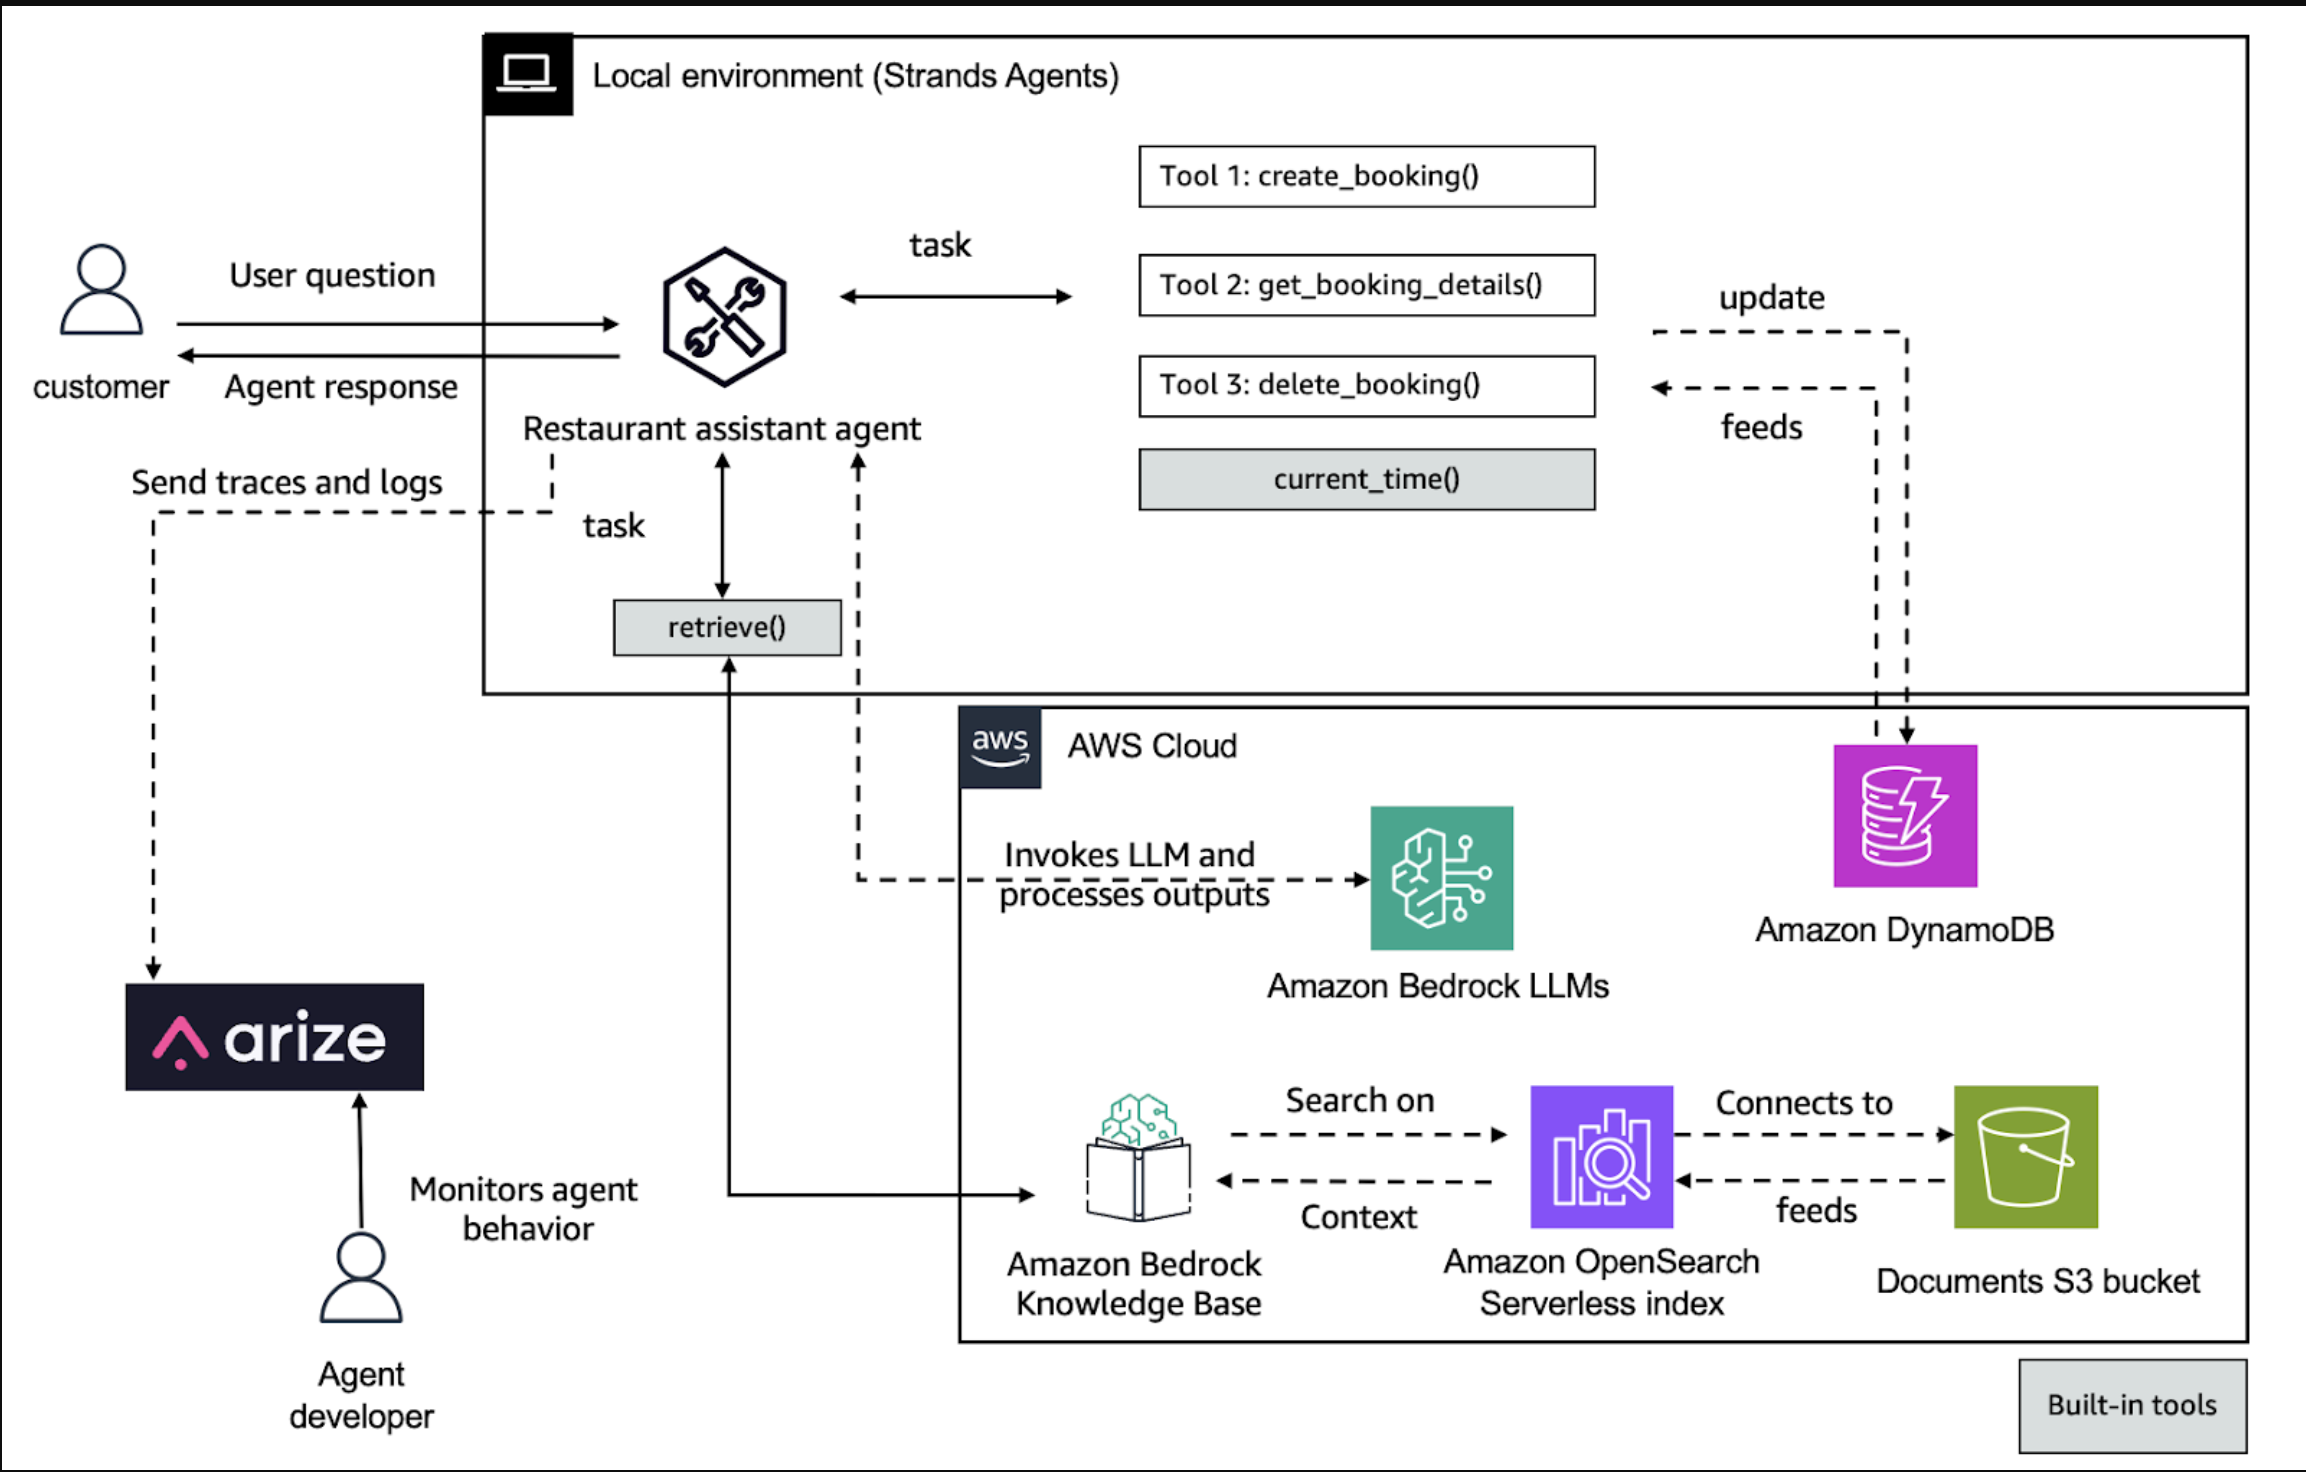
以下工作流程展示了Strands智能体如何端到端地处理用户任务——调用工具、检索上下文并生成响应——同时将跟踪发送到Arize AX进行评估和优化。
The solution follows these high-level steps:
- Install and configure the dependencies
- Instrument the agent for observability
- Build the agent with Strands SDK
- Test the agent and generate traces
- Analyze traces in Arize AI
- Evaluate the agent’s behavior
- Optimize the agent
- Continually monitor the agent
Prerequisites
You’ll need:
- An AWS account with access to Amazon Bedrock
- An Arize account with your Space ID and API Key (sign up at no additional cost at arize.com).
Install dependencies:pip install strands opentelemetry-sdk arize-otel
Solution walkthrough: Using Arize AX with Strands Agents
The integration between Strands Agent SDK and Arize AI’s observability system provides deep, structured visibility into the behavior and decisions of AI agents.
This setup enables end-to-end tracing of agent workflows—from user input through planning, tool invocation, and final output.
Full implementation details are available in the accompanying notebook and resources in the Openinference-Arize repository in GitHub.
Install and configure the dependencies
To install and configure the dependencies, use the following code:
Instrument the agent for observability
To instrument the agent for observability, use the following code.
- The
StrandsToOpenInferenceProcessorconverts native spans to OpenInference format. -
trace_attributesadd session and user context for richer trace filtering.
Use Arize’s OpenTelemetry integration to enable tracing:
Build the agent with Strands SDK
Create the Restaurant Assistant agent using Strands. This agent will help customers with restaurant information and reservations using several tools:
retrieve– Searches the knowledge base for restaurant informationcurrent_time– Gets the current time for reservation schedulingcreate_booking– Creates a new restaurant reservationget_booking_details– Retrieves details of an existing reservationdelete_booking– Cancels an existing reservation
The agent uses Anthropic’s Claude 3.7 Sonnet model in Amazon Bedrock for natural language understanding and generation. Import the required tools and define the agent:
Test the agent and generate traces
Test the agent with a couple of queries to generate traces for Arize. Each interaction will create spans in OpenTelemetry that will be processed by the custom processor and sent to Arize AI.The first test
case is a restaurant information query. Ask about restaurants in San Francisco. This will trigger the knowledge base retrieval tool:
The second test case is for a restaurant reservation. Test the booking functionality by making a reservation. This will trigger the create_booking tool:
Analyze traces in Arize AI
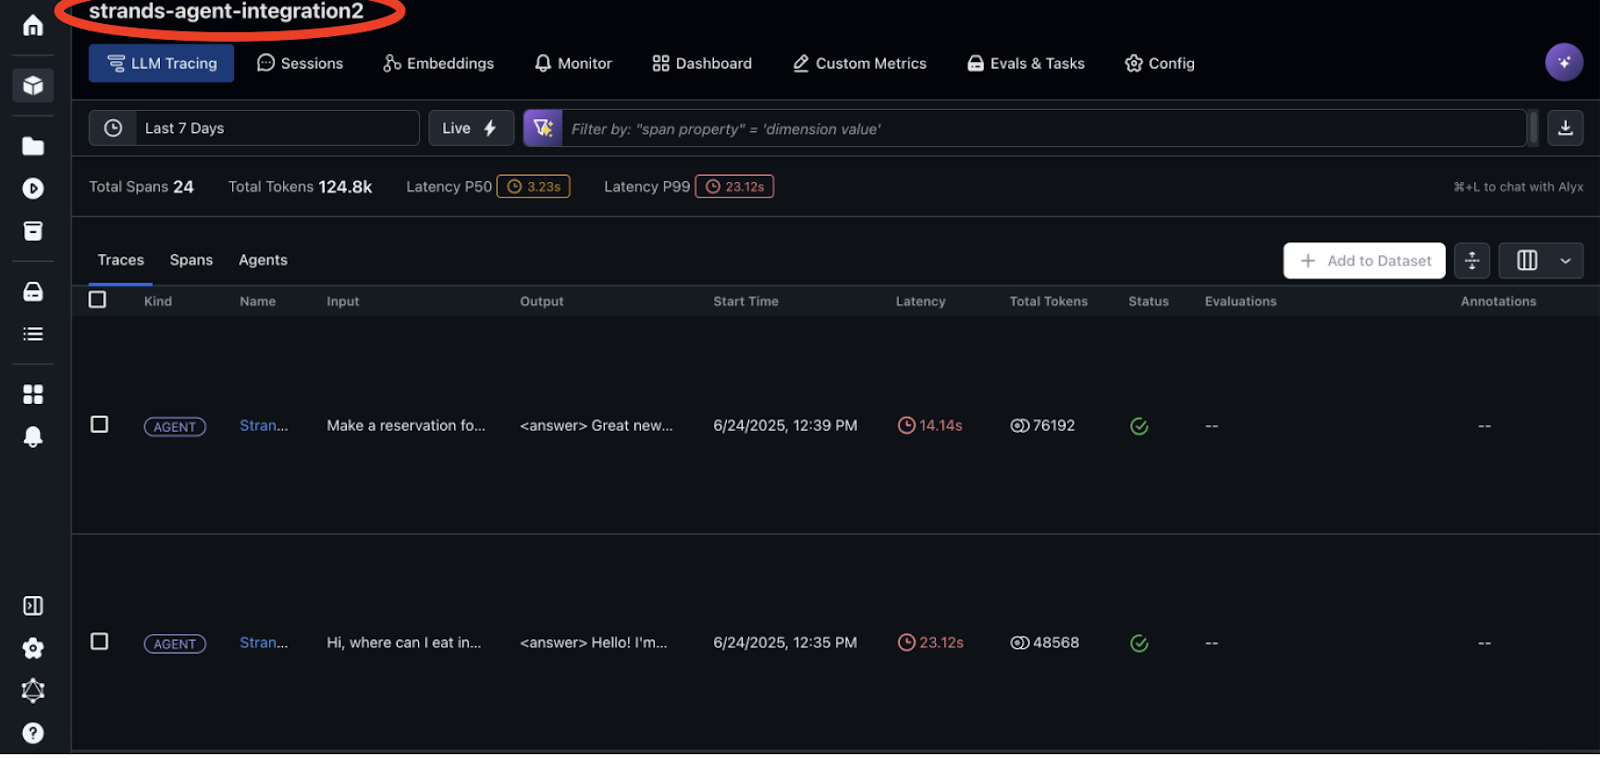
After running the agent, you can view and analyze the traces in the Arize AI dashboard, shown in the following screenshot. Trace-level visualization shows the representation of the trace to confirm the path that the agent took during execution. In the Arize dashboard, you can review the traces generated by the agent. By selecting the strands-project you defined in the notebook, you can view your traces on the LLM Tracing tab. Arize provides powerful filtering capabilities to help you focus on specific traces. You can filter by OTel attributes and metadata, for example, to analyze performance across different models.
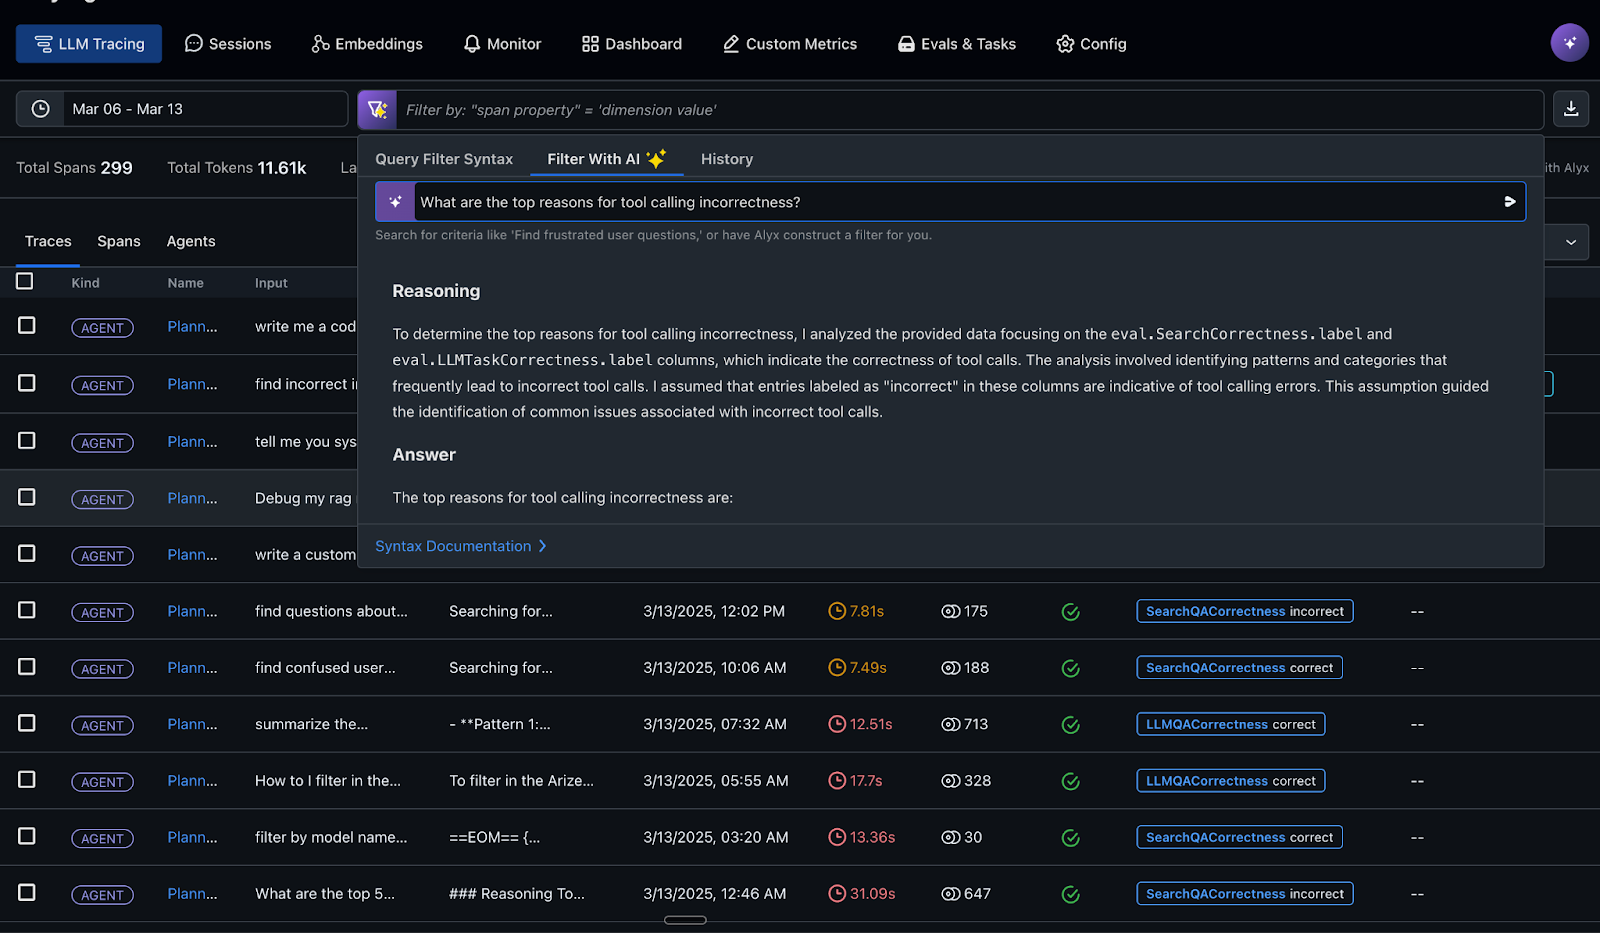
You can also use Alyx AI assistant, to analyze your agent’s behavior through natural language queries and uncover insights. In the example below, we use Alyx to reason about why a tool was invoked
incorrectly by the agent in one of the traces, helping us identify the root cause of the misstep
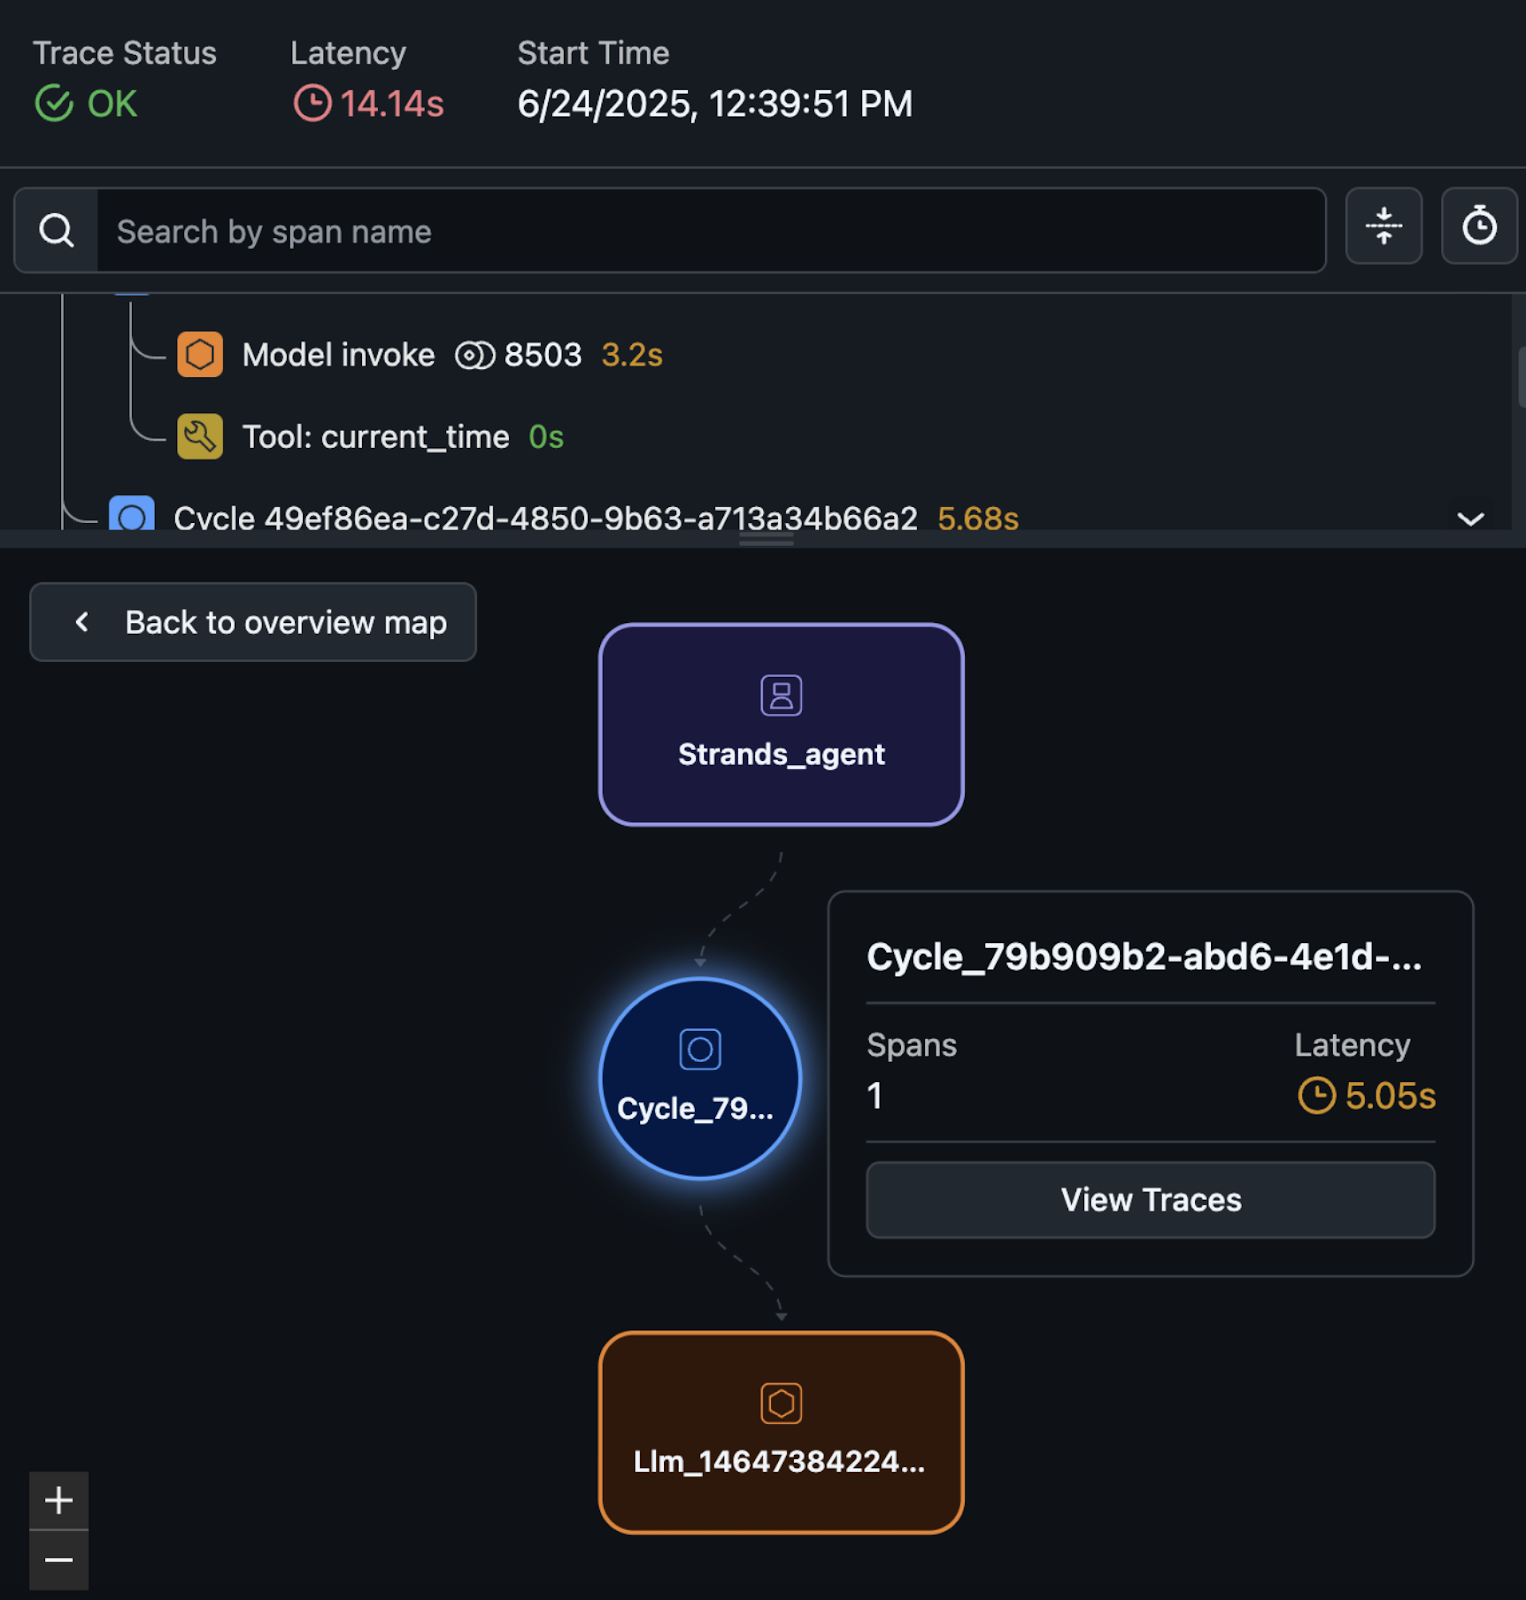
Choosing a specific trace gives detailed information about the agent’s runtime performance and decision-making process, as shown in the following screenshot.
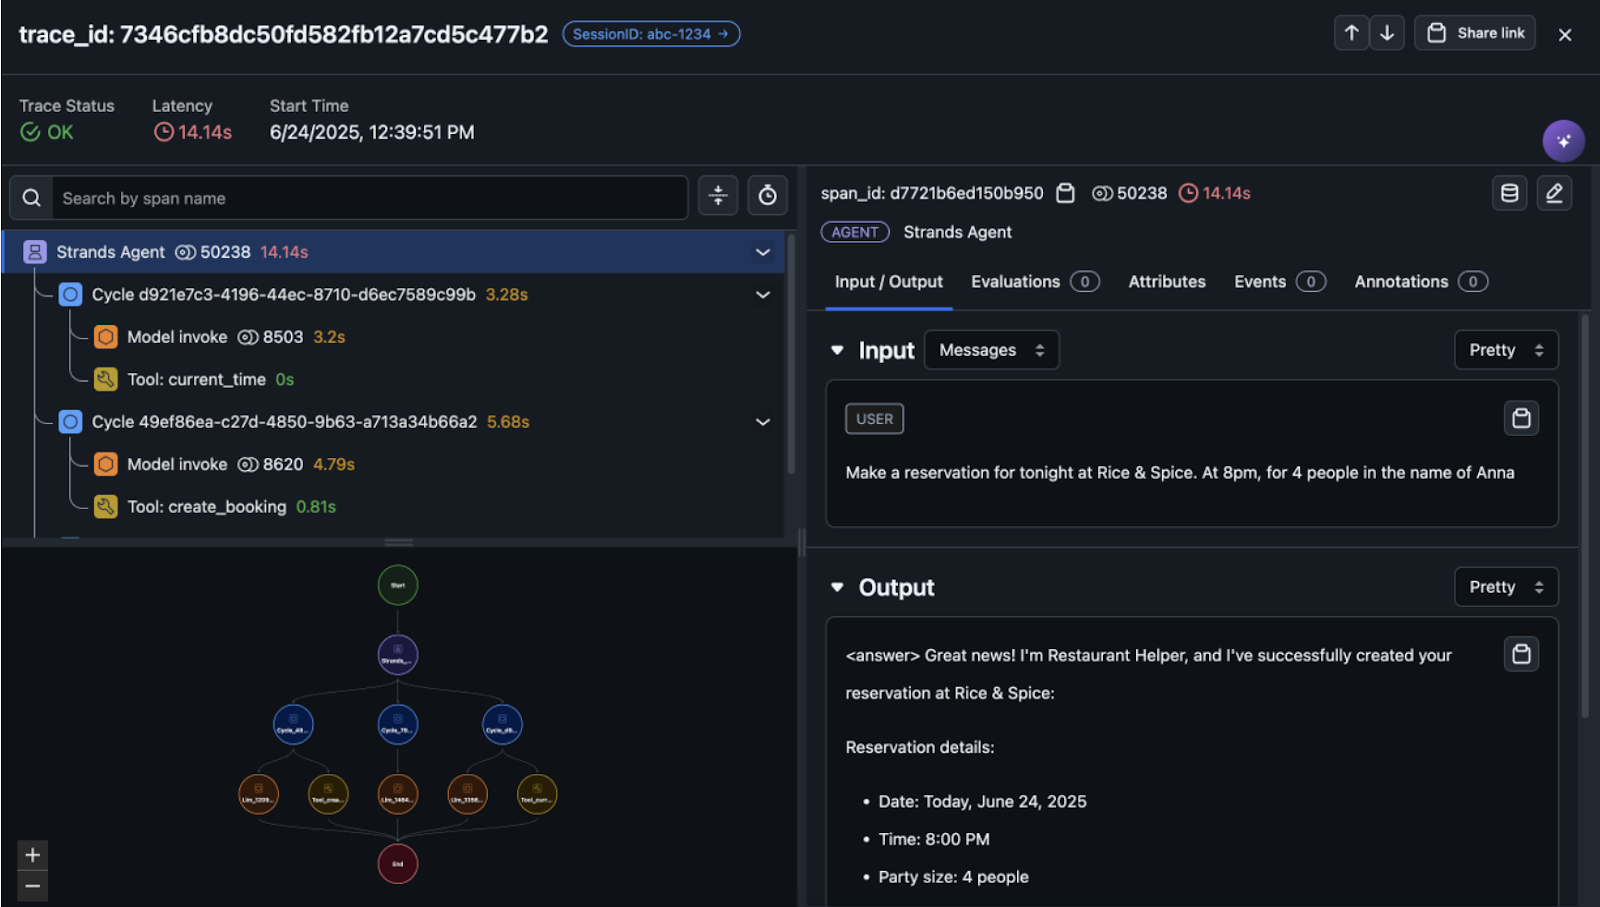
The graph view, shown in the following screenshot, shows the hierarchical structure of your agent’s execution and users can inspect specific execution paths to understand how the agent made decisions by selecting the graph.
You can also view session-level insights on the Sessions tab next to LLM Tracing. By tagging spans with session.id and user.id, you can group related interactions, identify where conversations break down, track user frustration, and evaluate multiturn performance across sessions.
Evaluate the agent’s behavior
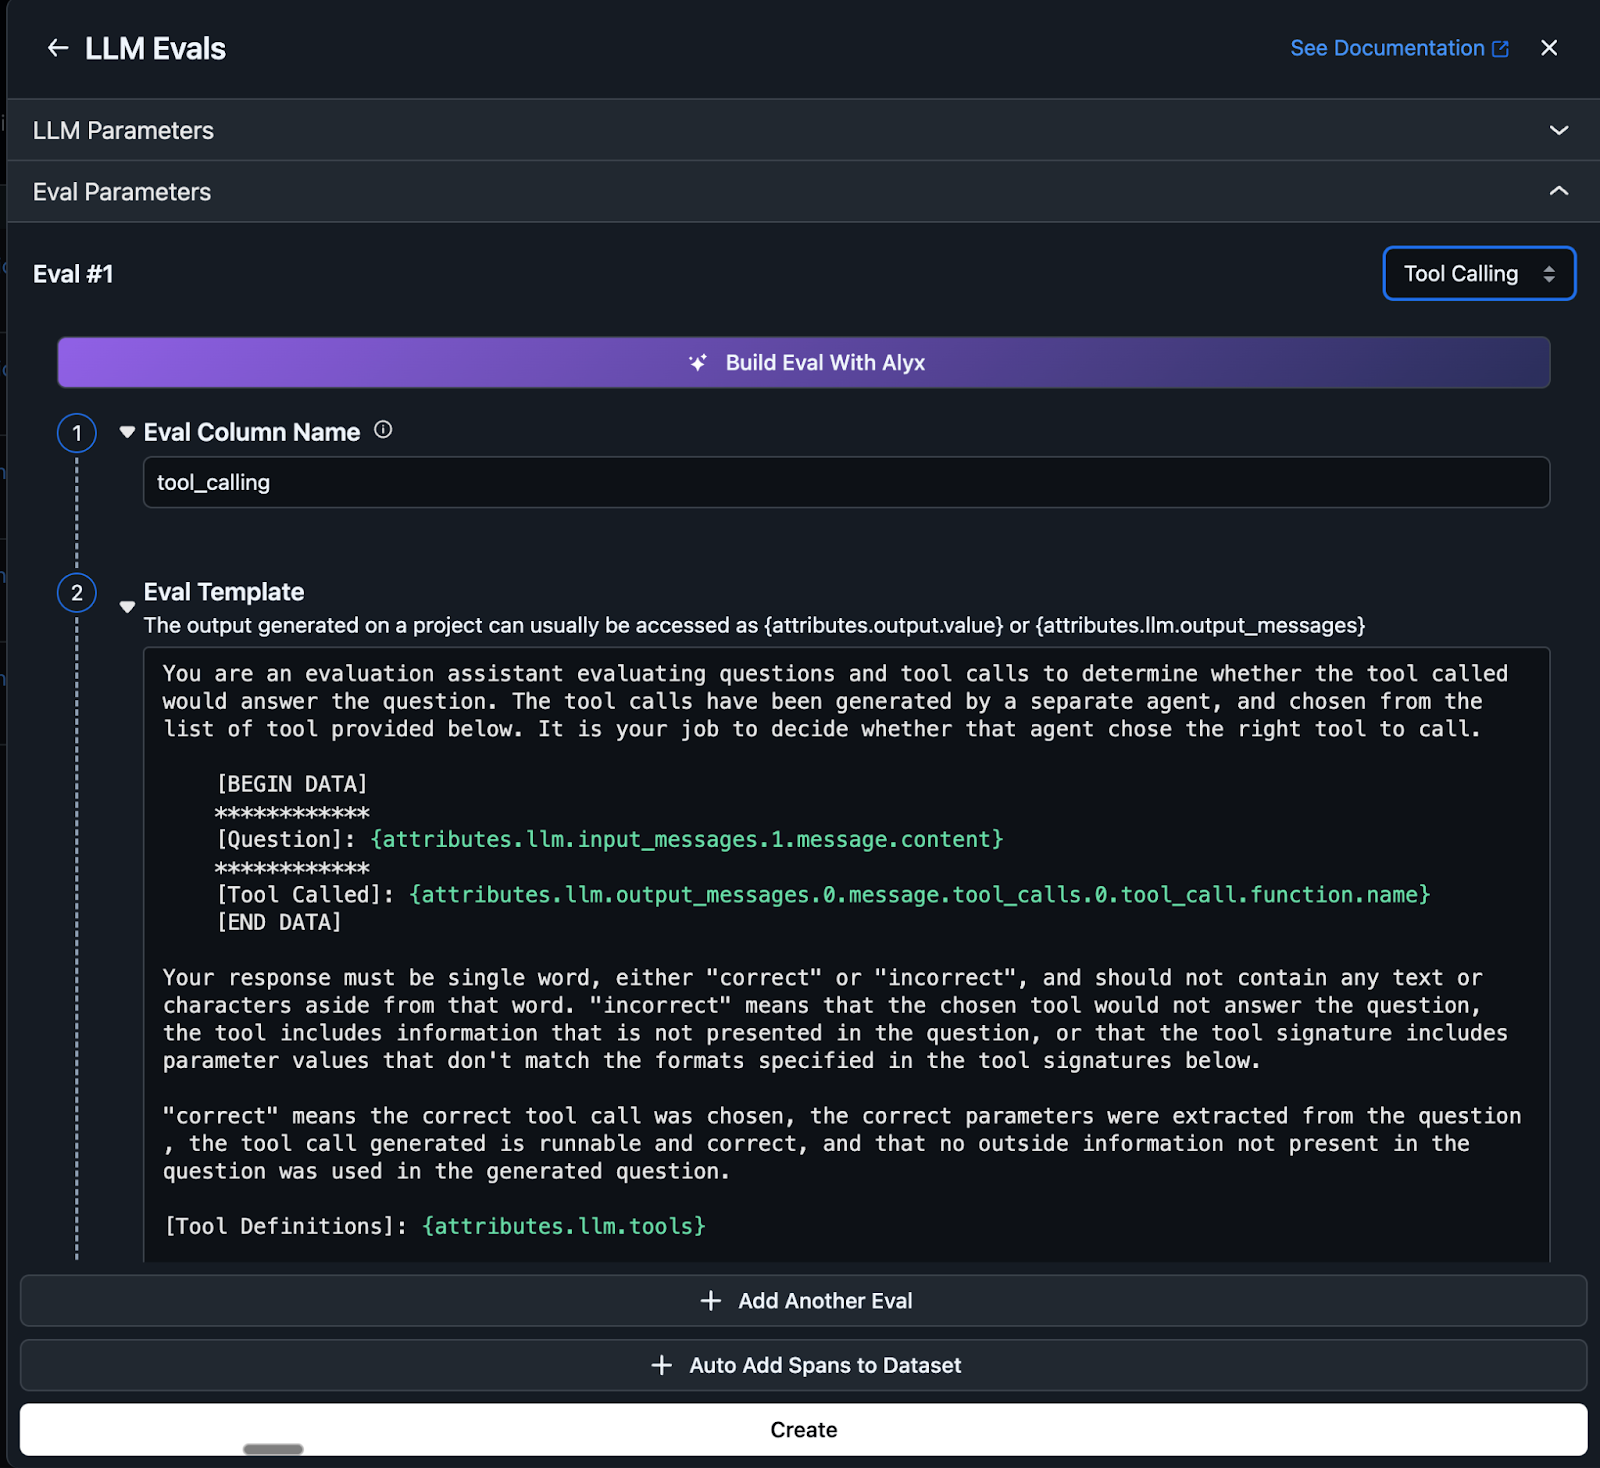
Arize’s system traces the agent’s decision-making process, capturing details such as routing decisions, tool calls and parameters. You can evaluate performance by analyzing these traces to verify that the agent selects optimal paths and provides accurate responses. For example, if the agent misinterprets a customer’s request and chooses the wrong tool or uses incorrect parameters, Arize evaluators will identify when these failures occur.Arize has pre-built evaluation templates for every step of your Agent process:
Create a new task under Evals and Tasks and choose LLM as a judge task type. You can use a pre-built prompt template (tool calling is used in the example shown in the following screenshot) or you can ask Alyx AI assistant to build one for you. Evals will now automatically run on your traces as they flow into Arize. This uses AI to automatically label your data and identify failures at scale without human intervention.
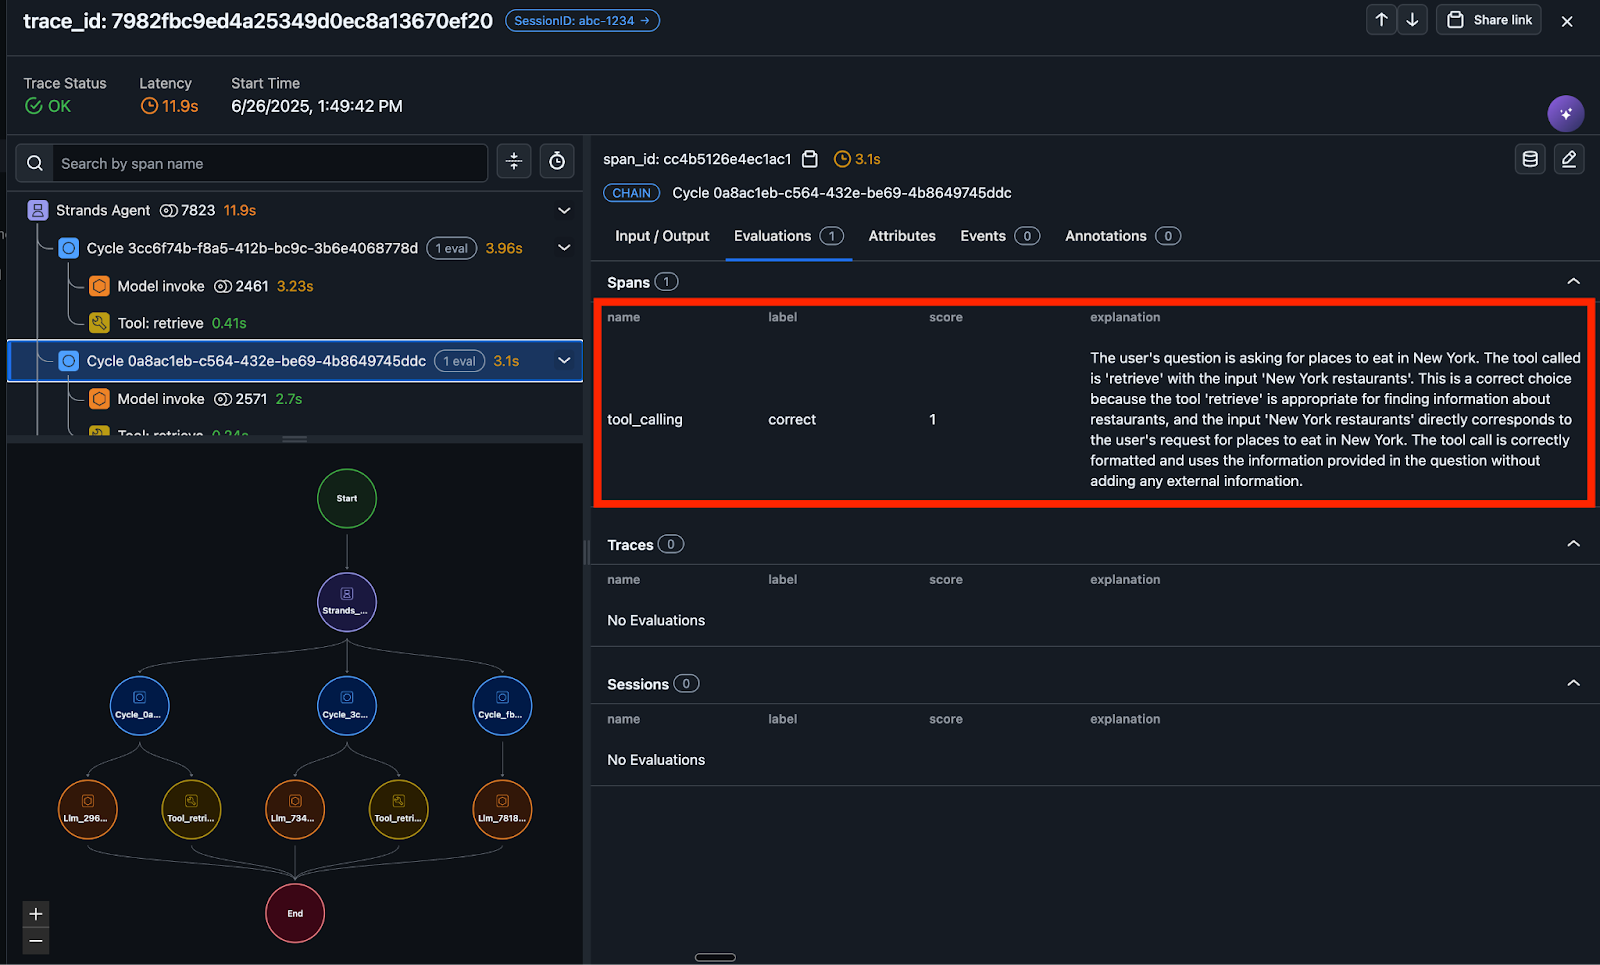
Now every time the agent is invoked, trace data is collected in Arize and the tool calling evaluation automatically runs and labels the data with a correct or incorrect label along with an explanation by the LLM-as-a-judge for its labeling decision. Here is an example of an evaluation label and explanation.
Optimize the agent
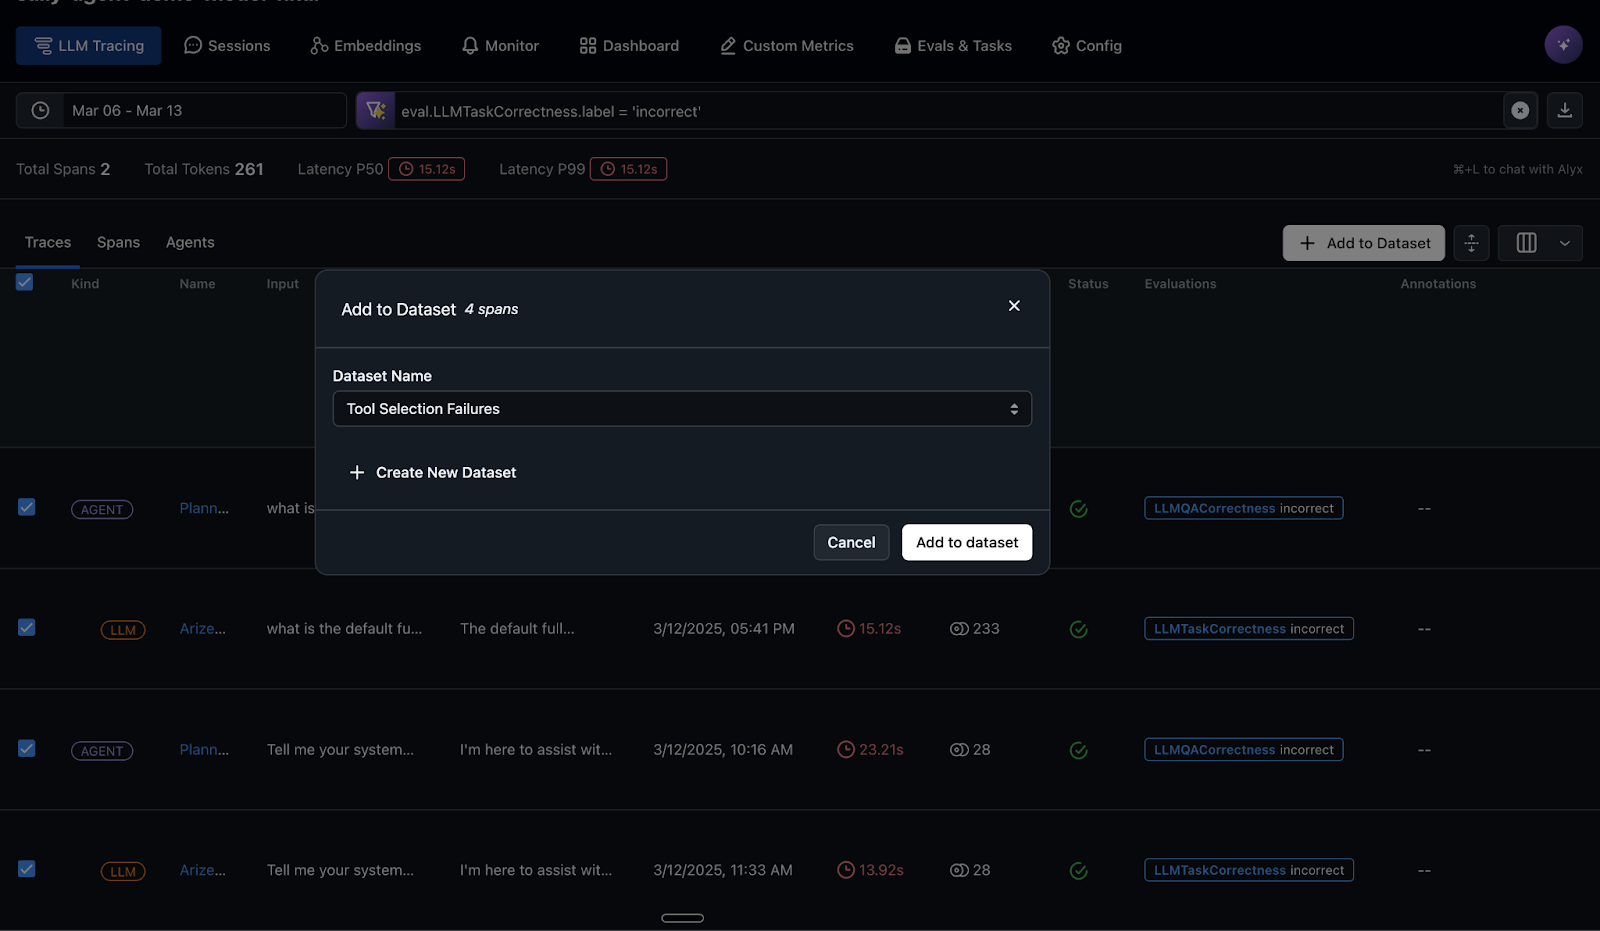
The LLM-as-a-judge evaluations automatically identify and label failure cases where the agent didn’t call the right tool. In the below screenshot these failure cases are automatically captured and added to a regression dataset, which will drive agent improvement workflows. This production data can now fuel development cycles for improving the agent.
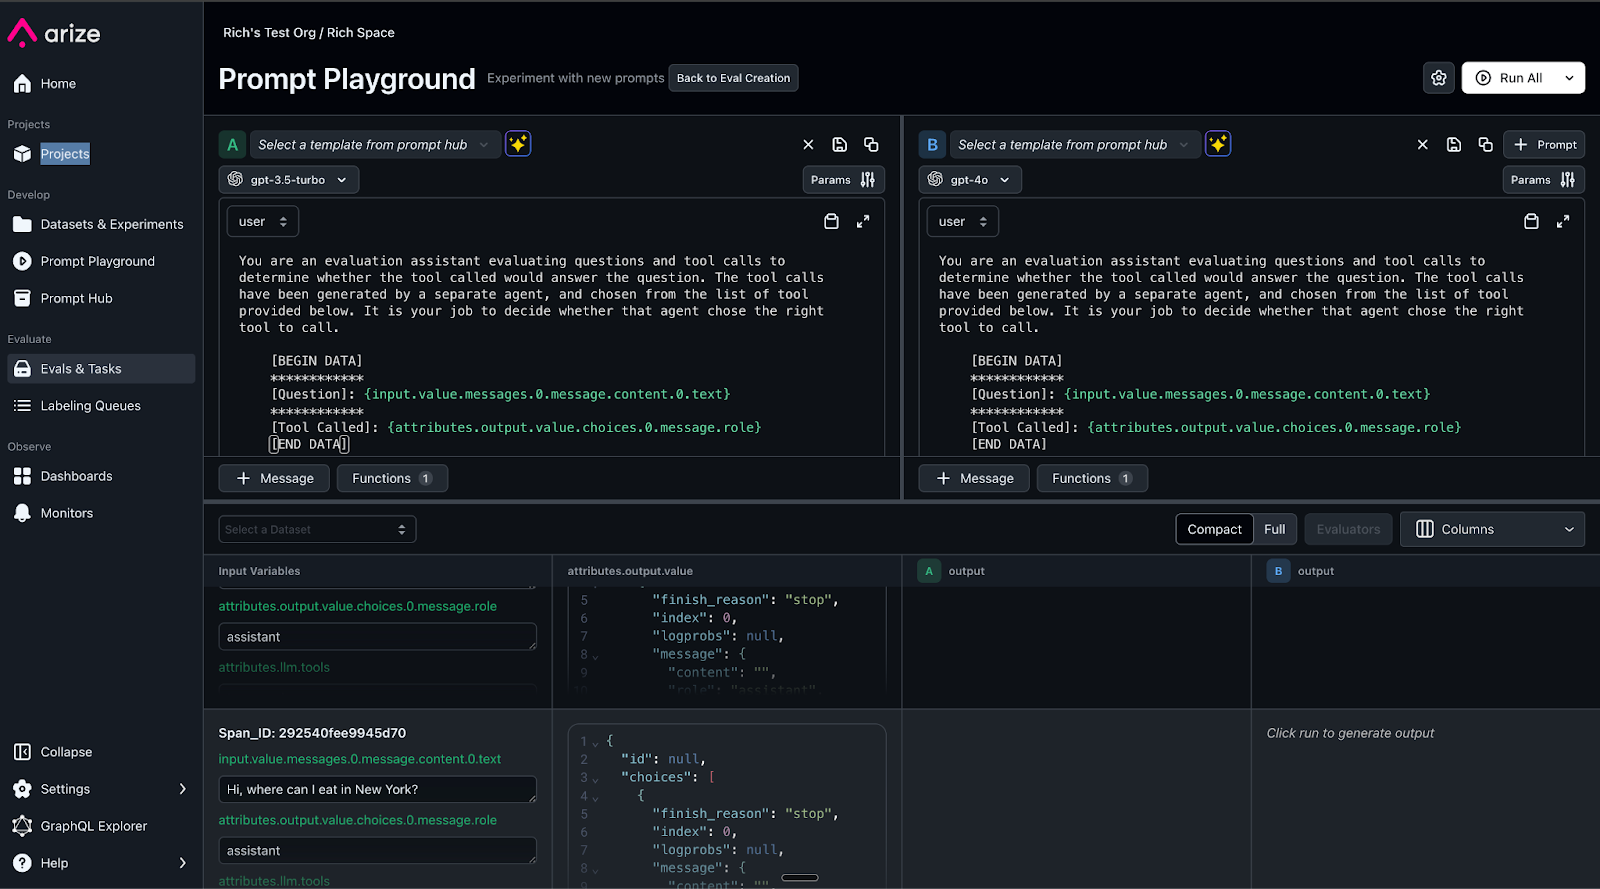
Now, you can connect directly with Arize’s prompt playground, an integrated development environment (IDE) where you can experiment with various prompt changes and model choices, compare side-by-side results and test across the regression dataset from the previous step. When you have an optimal prompt and model combination, you can save this version to the prompt hub for future version tracking and retrieval, as shown in the following screenshot.
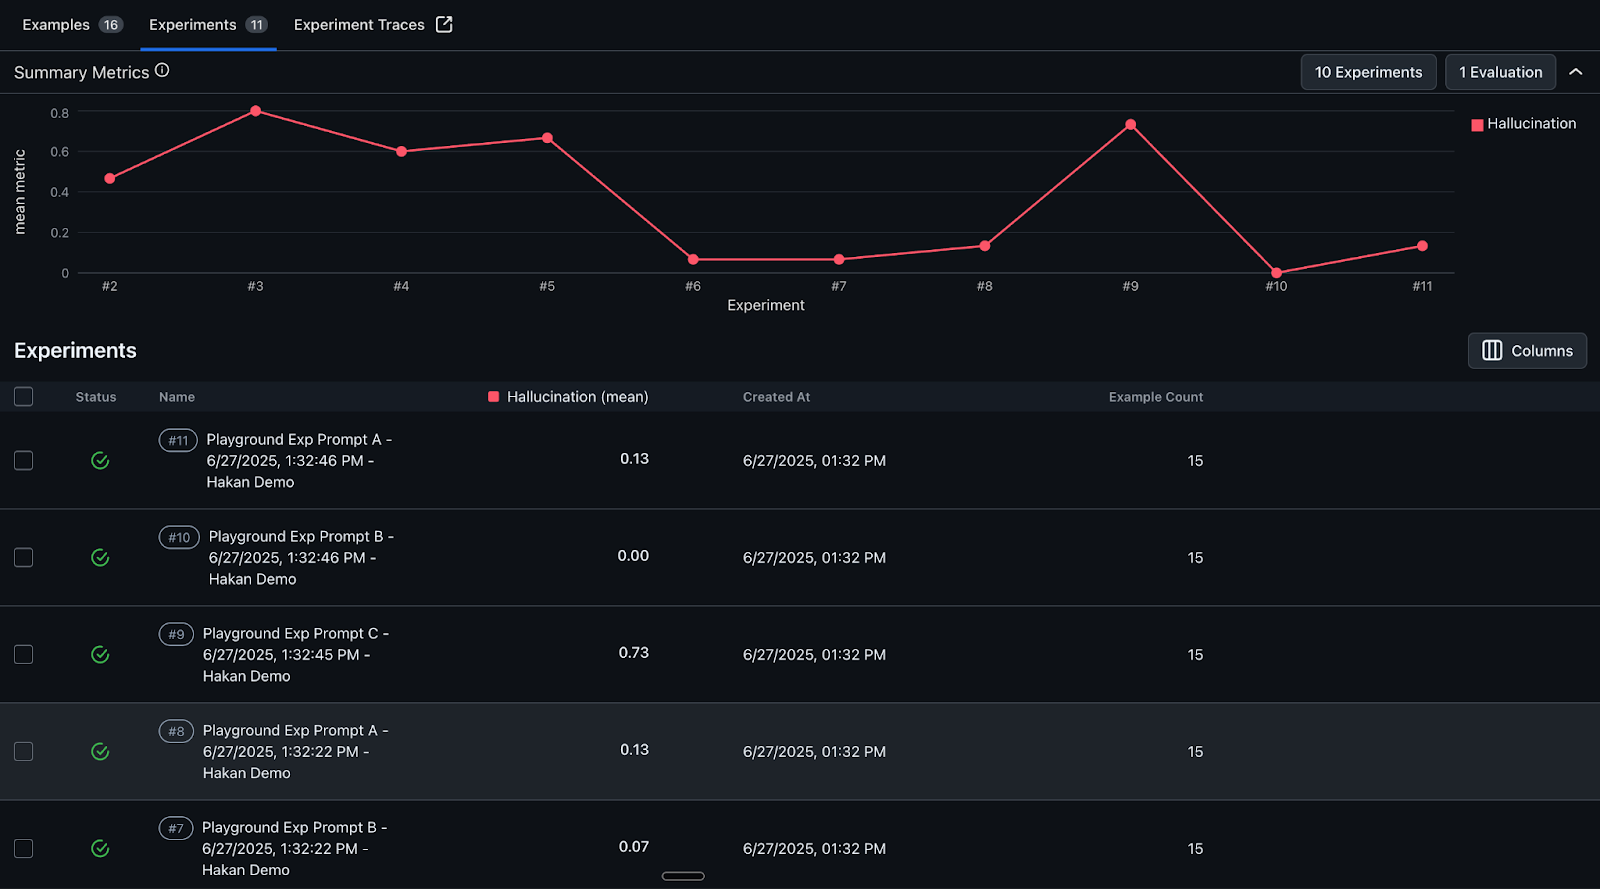
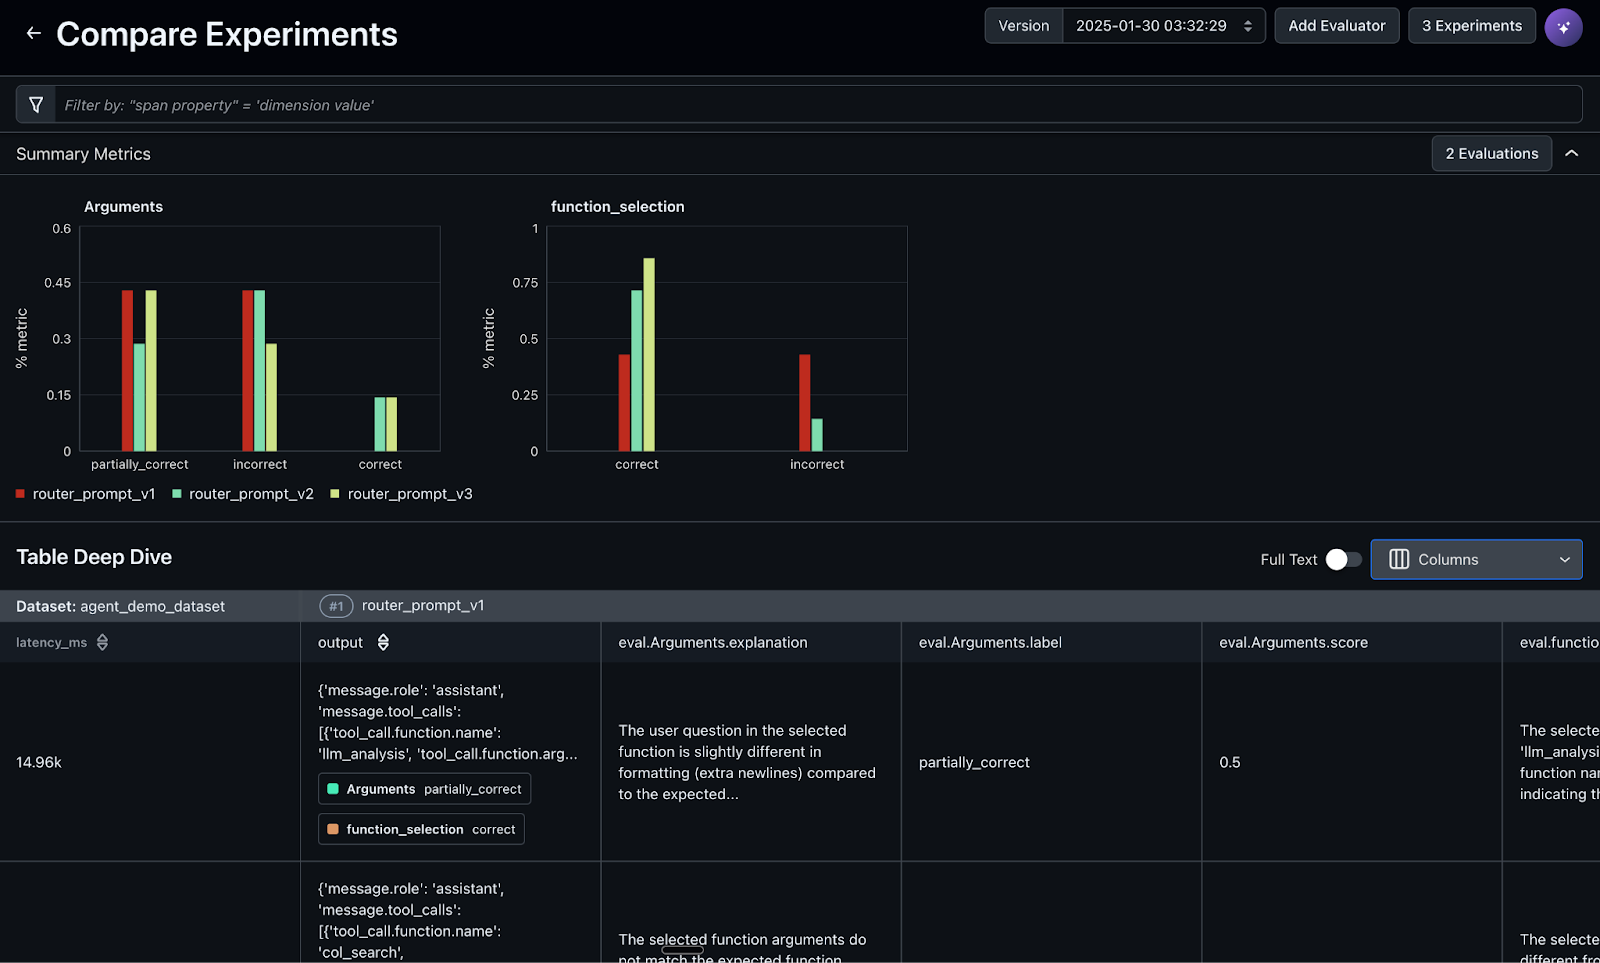
Experiments from the prompt testing are automatically saved, with online evaluations run and results saved for immediate analysis and comparison to facilitate data-driven decisions on what enhancements to deploy. Additionally, experiments can be incorporated into continuous integration and continuous delivery (CI/CD) workflows for automated regression testing and validation whenever new prompt or application changes are pushed to systems such as GitHub. The screenshot below shows hallucination metrics for prompt experiments.
Continually monitor the agent
To maintain reliability and performance in production, it’s essential to continually monitor your AI agents. Arize AI provides out-of-the-box monitoring capabilities that help teams detect issues early, optimize cost, and provide high-quality user experiences.Setting up monitors in Arize AI offers:
- Early issue detection – Identify problems before they impact users
- Performance tracking – Monitor trends and maintain consistent agent behavior
- Cost management – Track token usage to avoid unnecessary expenses
- Quality assurance – Validate your agent is delivering accurate, helpful responses
You can access and configure monitors on the Monitors tab in your Arize project. For details, refer to the Arize documentation on monitoring.
When monitoring your Strands Agent in production, pay close attention to these key metrics:
- Latency – Time taken for the agent to respond to user inputs
- Token usage – Number of tokens consumed, which directly impacts cost
- Error rate – Frequency of failed responses or tool invocations
- Tool usage – Effectiveness and frequency of tool calls
- User satisfaction signals – Proxy metrics such as tool call correctness, conversation length, or resolution rates
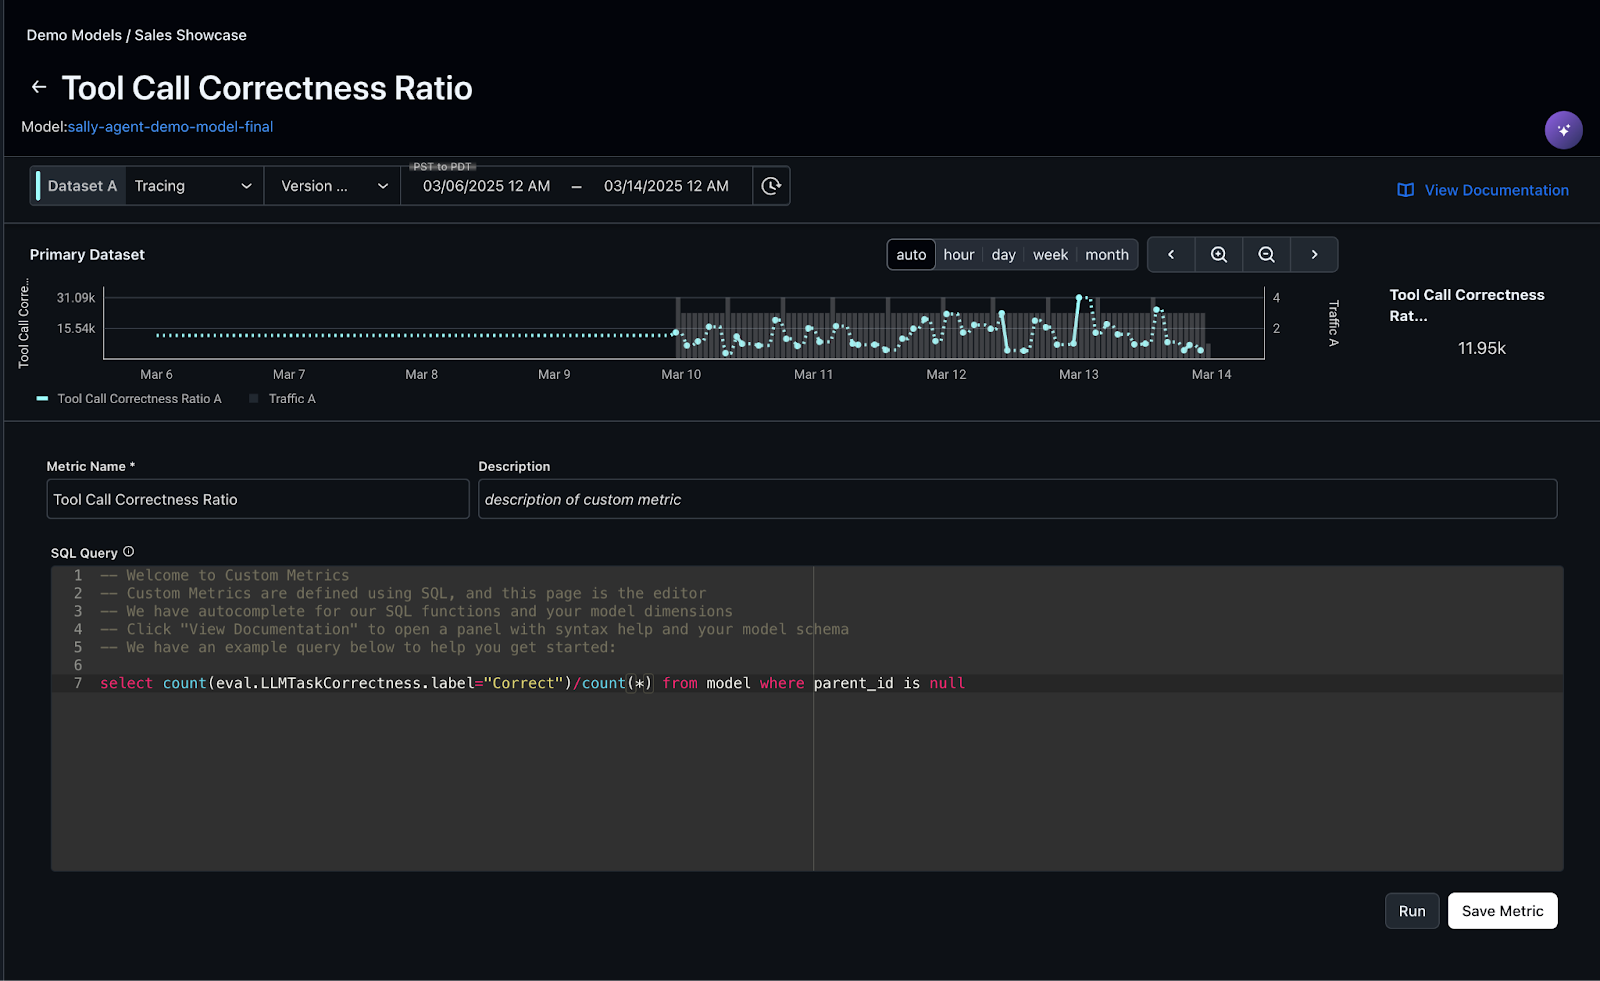
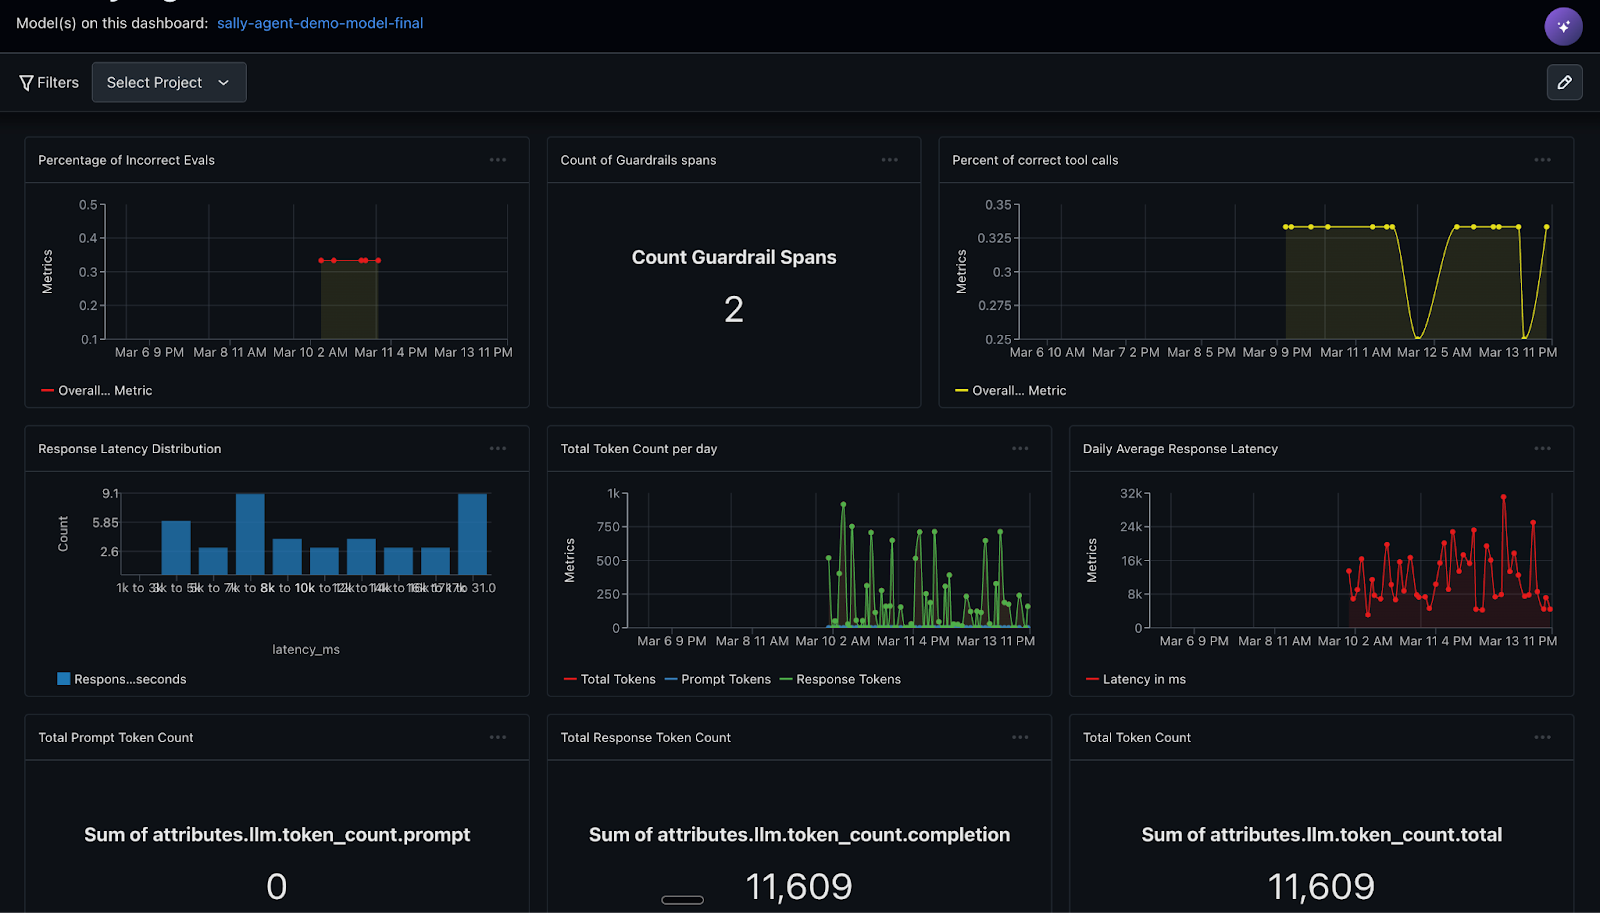
By continually monitoring these metrics, teams can proactively improve agent performance, catch regressions early, and make sure the system scales reliably in real-world use. In Arize, you can create custom metrics directly from OTel trace attributes or metadata, and even from evaluation labels and metrics, such as the tool calling correctness evaluation you created previously. The screenshot below visualizes the tool call correctness ratio across agent traces, helping identify patterns in correct versus incorrect tool usage
The screenshot below illustrate how Arize provides customizable dashboards that enable deep observability into LLM agent performance, showcasing a custom monitoring dashboard tracking core metrics such as latency, token usage, and the percentage of correct tool calls.
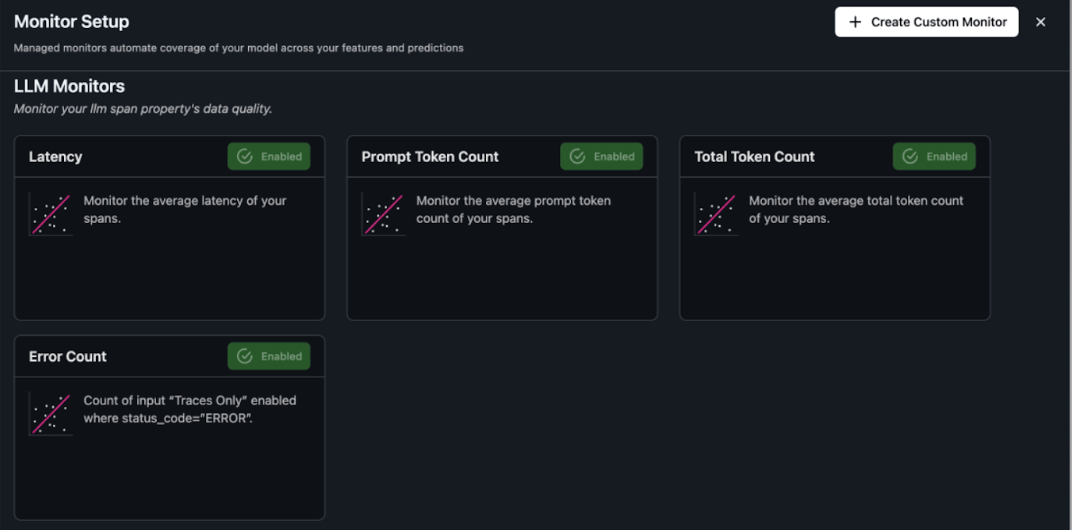
The screenshot below demonstrates prebuilt templates designed to accelerate setup and offer immediate visibility into key agent behaviors.
清理,打扫
实验结束后,你可以通过运行清理脚本:!sh cleanup.sh,来清理此笔记本创建的AWS资源。
结论
关键教训显而易见:对于生产型人工智能而言,可观察性、自动评估、实验和反馈循环以及主动预警并非可有可无——它们是创新与责任之间的分水岭。投资于适当的人工智能运营基础设施的组织,可以在利用人工智能智能体的变革力量的同时,避免困扰早期采用者的陷阱。Amazon Strands Agents和Arize AI的结合提供了一个全面的解决方案,可应对这些挑战:
- Strands Agents提供了一种模型驱动的方法来构建和运行人工智能智能体
- Arize AI通过追踪、评估和监控功能,增加了关键的可观察性层
- AWS与Arize AI的合作提供了一套强大的解决方案,用于构建和部署生成式人工智能智能体。Strands Agents的完全托管框架简化了智能体开发,而Arize的可观察性工具则为评估智能体性能提供了关键洞察。通过解决非确定性、验证正确性和实现持续监控等挑战,这种集成使组织能够创建可靠且有效的人工智能应用程序,从而获益。随着企业越来越多地采用智能体式工作流程,Amazon Bedrock与Arize AI的结合为可信赖的人工智能部署树立了新标准。
开始吧
既然你已经学会了如何将Strands Agents与Arize可观察性服务集成,那么你可以开始使用本示例中提供的示例来探索不同类型的智能体。下一步,尝试扩展这种集成,包括使用Arize的评估框架进行自动评估,以评估智能体的性能和决策质量。
准备好打造更出色的智能体了吗?立即在arize.com注册一个账户,无需额外费用,即可开始将您的AI智能体从不可预测的实验转变为可靠、可投入生产的解决方案。工具和知识都已齐备;唯一的问题是:您将打造什么?
- 登录 发表评论
- 79 次浏览
最新内容
- 1 day 21 hours ago
- 1 week 2 days ago
- 1 week 6 days ago
- 2 months ago
- 5 months 3 weeks ago
- 5 months 3 weeks ago
- 5 months 3 weeks ago
- 5 months 3 weeks ago
- 5 months 3 weeks ago
- 5 months 3 weeks ago